Median Age
39 Years
Largest Age Group
30-39 Years
Approximately 18% of Residents
Under 20
21%
Over 65
16%


Avg Rent
$1,510
Population
15,100
Renter Mix
57% Rent
Sitting at the spot where the Ohio and Licking rivers meet, Newport, Kentucky puts you right across the water from Downtown Cincinnati without the big-city price tag. That riverfront position shapes just about everything here, from sweeping skyline views to a lively entertainment scene anchored by the Newport Aquarium and the Newport on the Levee complex. The city is part of the greater Cincinnati metropolitan area, which means residents have access to a major economic and cultural hub while still enjoying the distinct character of a smaller Kentucky community.
Newport's East Row Historic District is one of the area's most recognizable pockets, featuring beautifully preserved 19th-century architecture and a walkable stretch of local shops and eateries. The city carries deep historical roots as well: it was named not for its riverside location, but for Christopher Newport, captain of the first ship to reach Jamestown, Virginia, in 1607. Annual events like Glier's Goettafest and Riverfest reflect the strong community spirit that has long defined this river town.
The rental market here offers solid variety for apartment hunters. You'll find everything from restored historic buildings converted into apartment communities to newer mid-rise developments near the waterfront. Townhomes, studio lofts, and multi-bedroom units round out the options, giving renters a range of styles and sizes to consider throughout this compact, walkable city.
The Newport Dog Park is a place for furry residents to enjoy the great outdoors in Newport, KY.
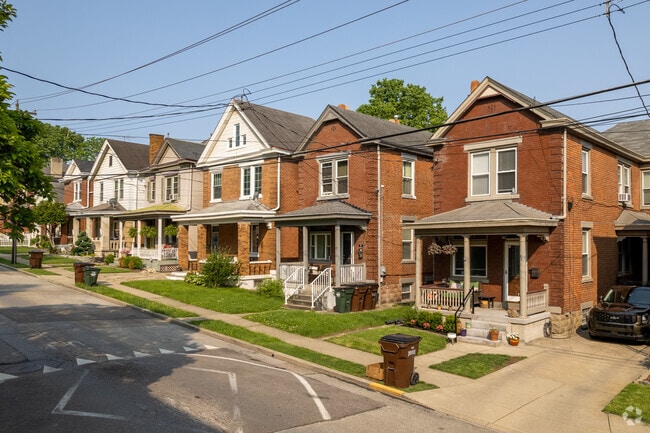
Because of Newport's age, rows of early 20th-century homes appear throughout the city.
General James Taylor Park in Newport has picnic tables and a playground.
The Newport Riverwalk is loved by many because of the views.
Newport Aquarium is home to thousands of animals in a million gallons of water in Newport.
Newport is divided into nine distinct neighborhoods and showcases many historical homes.
Median Household Income
$60,492
Average: $91,830
Education
4,476
Residents Have a Degree
Job Market
6,747
Workers Employed
Median Age
39 Years
Largest Age Group
30-39 Years
Approximately 18% of Residents
Under 20
21%
Over 65
16%
Housing Distribution
Newport has more renters than homeowners.

Education Distribution
Review this city's overall education levels.

As of July 2026, the average apartment rent in Newport, KY is $954 for a studio, $1,511 for one bedroom, $1,789 for two bedrooms, and $3,884 for three bedrooms. Apartment rent in Newport has increased by 7.8% in the past year.
Explore how walkable, bikeable, drivable, and transit-friendly Newport, KY is for everyday living.
Moderately Walkable
Walkability
Some Public Transit
Transit
Exceptionally Drivable
Drivability
Fairly Bikeable
Bikeability
Public
Grades K-5
369 Students

Public
Grades PK-5
377 Students

Public
Grades K-12
76 Students
Mildred Dean Elementary School
Public
Grades PK-5
Public
Grades 6-12
498 Students

Public
Grades 6-9
378 Students
Public
Grades K-12
76 Students
Public
Grades 6-12
498 Students
Public
Grades K-12
76 Students
† Our analysis of utilities, groceries, transportation, healthcare, home prices, and other goods and services is sourced from the Cost of Living Index, a respected benchmark published by the Council for Community and Economic Research (C2ER) that provides a thorough overview of living expenses across different regions.
Rent data is provided by CoStar Group’s Market Trend reports. As the industry leader in commercial real estate information, analytics, and news, CoStar conducts extensive research to produce and maintain a comprehensive database of commercial real estate information. We combine this data with public record to provide the most up-to-date rental information available.
Consumer goods, services, and home prices are sourced from the Cost of Living Index published by the Council for Community and Economic Research (C2ER). The data on this page is updated quarterly. It was last published in June 2026.
Demographic information comes from Neustar and combines detailed address data with U.S. Census and American Community Survey statistics to produce reliable local estimates.


