
Londondale Village
1420 Londondale Pky,
Newark, OH 43055
$1,300 - $1,700
2-3 Beds

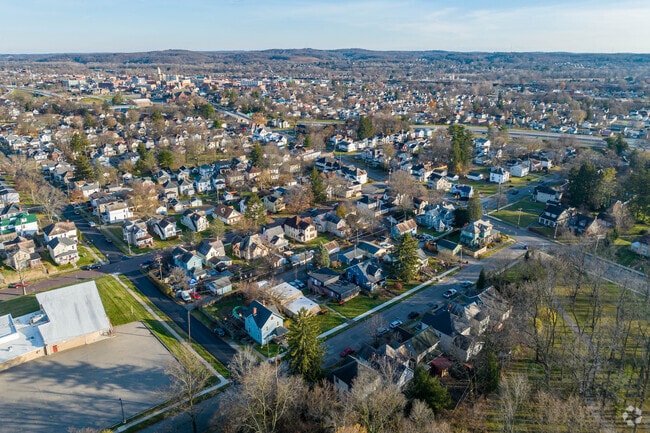
Newark, Ohio, located 40 miles east of Columbus, combines historical significance with contemporary living. The rental market shows steady growth, with one-bedroom units averaging $817 monthly and two-bedroom homes typically renting for $1,085. Recent trends indicate steady increases across all rental categories, with year-over-year changes ranging from 3.3% to 6.8%, reflecting the area's stable housing market.
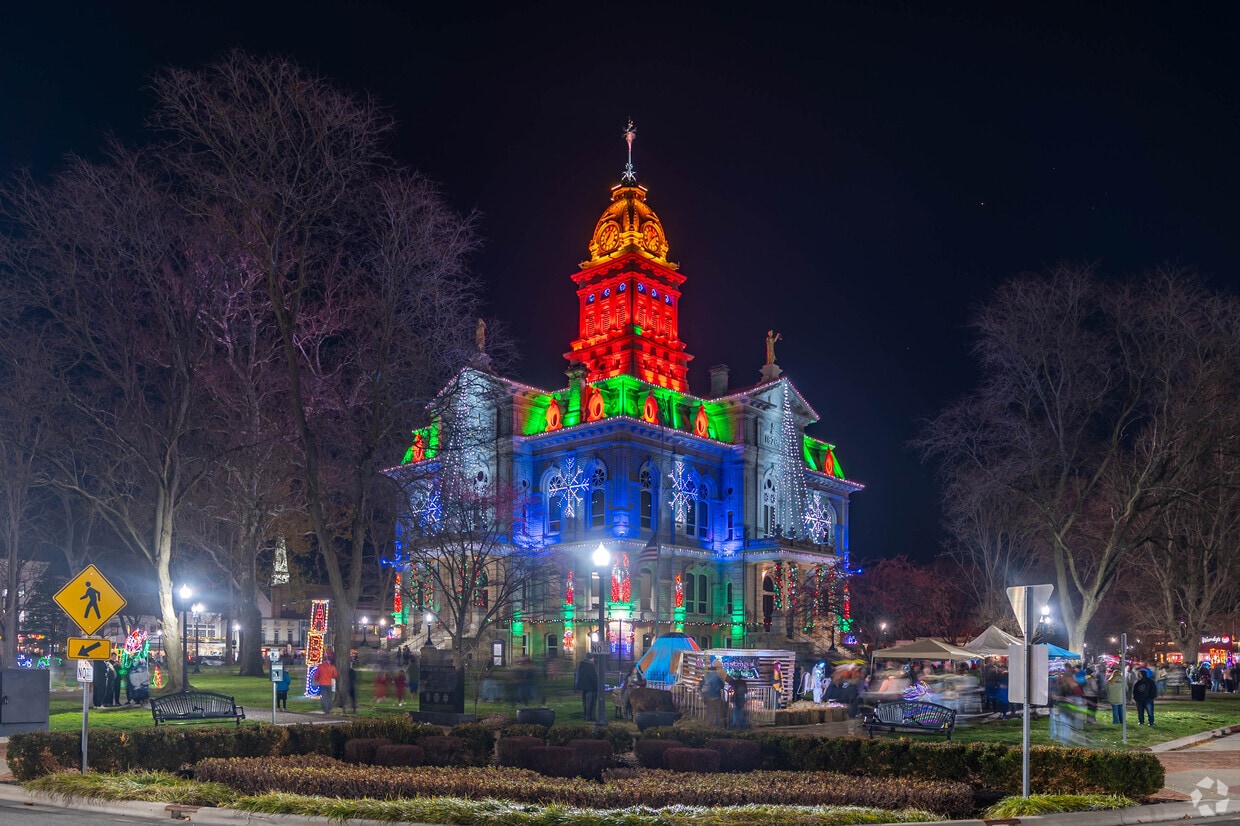
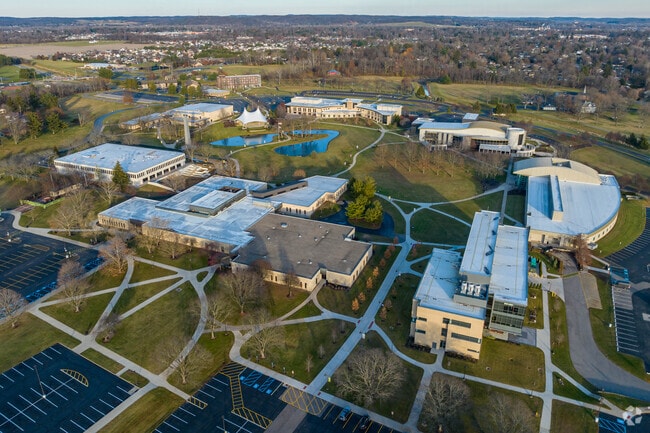
Newark offers easy access to outdoor destinations like Dawes Arboretum, spanning 2,000 acres of gardens and woodlands, and Blackhand Gorge State Nature Preserve, featuring hiking trails along dramatic sandstone cliffs. The Newark Earthworks, an ancient Native American site and National Historic Landmark, showcases geometric mounds that draw visitors from across the country. Downtown's architectural heritage includes the Licking County Courthouse, with its distinctive Second Empire design, and the restored Midland Theatre. Indian Mound Mall serves as the area's primary shopping destination. The Ohio State University Newark campus and Central Ohio Technical College contribute to the city's educational landscape. Notable areas include the Hudson Avenue district, characterized by historic architecture, and the north end area with its established residential streets.
Newark is a beautiful and charming neighborhood.
Some students attend the Ohio State University Newark Campus.
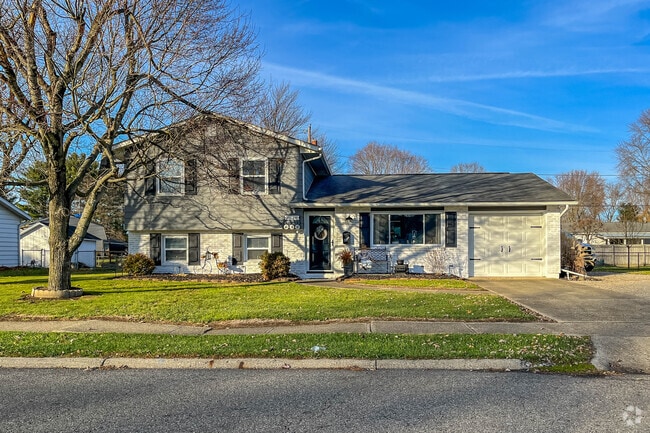
Single family homes are common in Newark.
Try a specialty latte at River Road Coffeehouse in Newark.
Welcome to Newark.
You'll see a number of statues around Newark.
As of March 2026, the average apartment rent in Newark, OH is $696 for a studio, $936 for one bedroom, $1,172 for two bedrooms, and $1,334 for three bedrooms. Apartment rent in Newark has increased by 2.5% in the past year.
Explore how walkable, bikeable, drivable, and transit-friendly Newark, OH is for everyday living.
Car-Dependent
This area is considered a car-dependent area and most errands will require a car.
Somewhat Bikeable
You might be able to find places to ride your bike in this area, but you’ll most likely want your car for most errands.
Public
Grades PK-5

Public
Grades K-5
Ben Franklin Elementary School
Public
Grades K-5

Licking Valley Elementary School
Public
Grades K-5
Public
Grades K-5

Public
Grades 6-8

Public
Grades 6-8
Public
Grades 6-8

Public
Grades 6-8
Public
Grades 9-12
Public
Grades 9-12


315
Communities
76,967
Units
144
Cities

13
Communities
1,632
Units
10
Cities
144
Communities
19,026
Units
116
Cities

93
Communities
21,447
Units
52
Cities

25
Communities
8,894
Units
17
Cities

36
Communities
7,619
Units
15
Cities
† Our analysis of utilities, groceries, transportation, healthcare, home prices, and other goods and services is sourced from the Cost of Living Index, a respected benchmark published by the Council for Community and Economic Research (C2ER) that provides a thorough overview of living expenses across different regions.
Rent data is provided by CoStar Group’s Market Trend reports. As the industry leader in commercial real estate information, analytics, and news, CoStar conducts extensive research to produce and maintain a comprehensive database of commercial real estate information. We combine this data with public record to provide the most up-to-date rental information available.
Consumer goods, services, and home prices are sourced from the Cost of Living Index published by the Council for Community and Economic Research (C2ER). The data on this page is updated quarterly. It was last published in February 2026.


