Median Age
47 Years
Largest Age Group
60-69 Years
Approximately 15% of Residents
Under 20
20%
Over 65
26%

Avg Rent
$1,472
Population
39,290
Renter Mix
25% Rent
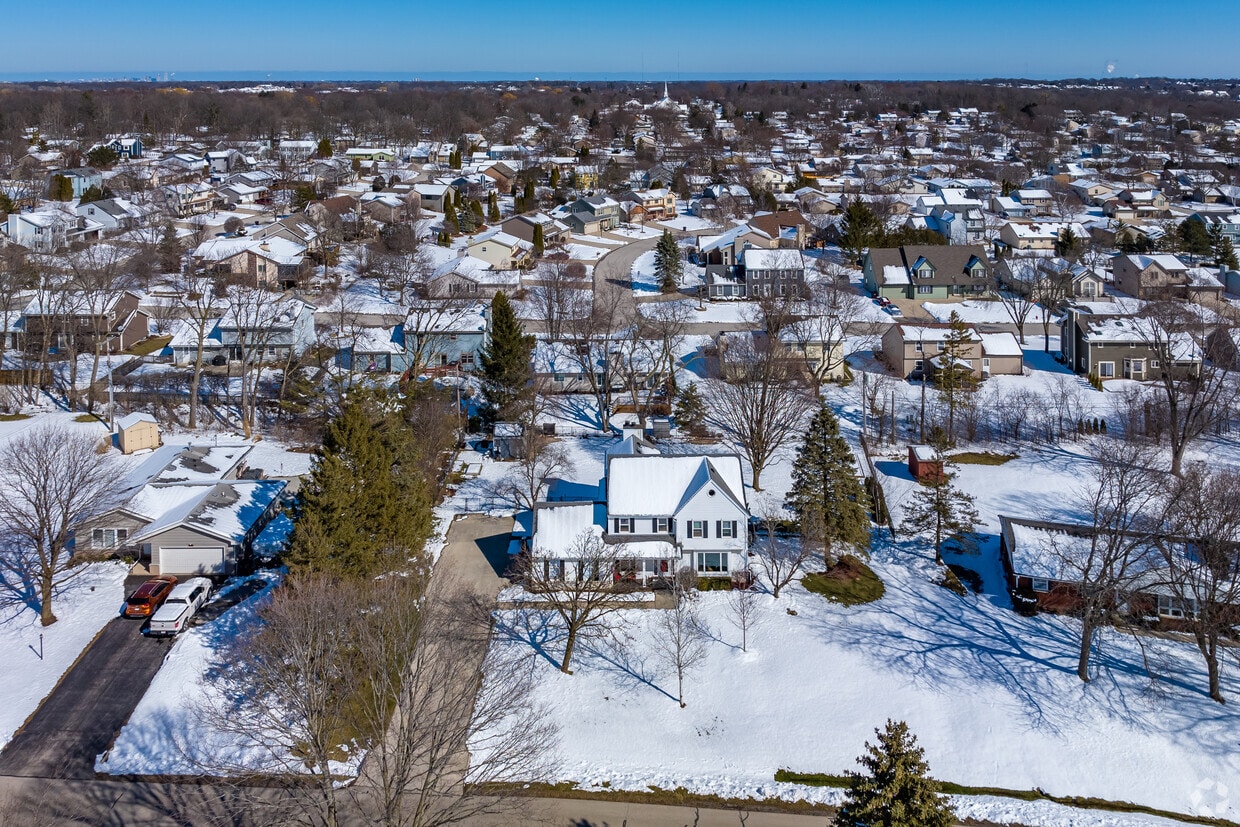
New Berlin is a peaceful suburb situated between Waukesha and Milwaukee. New Berlin residents enjoy access to top-notch public schools in addition to the many shopping and dining options available at nearby Brookfield Square and Southridge Mall.
Brimming with lush greenery, New Berlin offers residents plenty of opportunities to enjoy the outdoors, with Minooka Park, Greenfield Park, Whitnall Park, and multiple golf courses all located within close reach of the city. Area attractions such as the Milwaukee County Zoo, Wisconsin State Fair Park, and Miller Park—the Brewers’ home field—are all just a short drive away from New Berlin as well. Commuting and traveling from New Berlin is easy with access to I-43, I-41, and I-94 as well as General Mitchell International Airport.
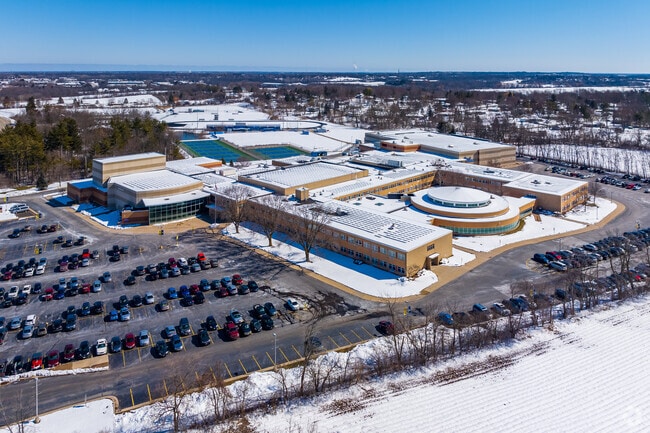
New Berlin West Middle/High School received an A- from Niche.
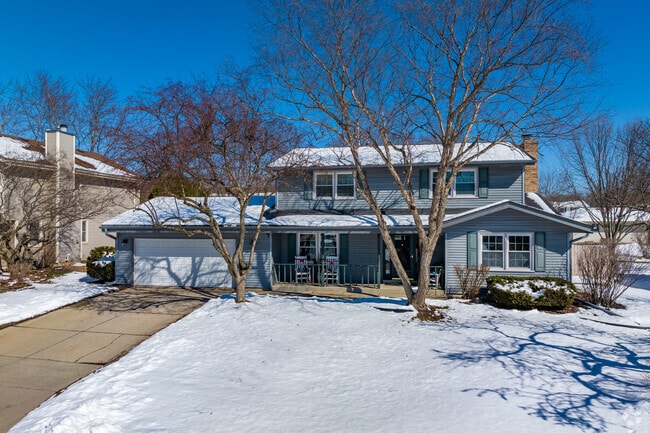
The average home price in New Berlin is $423,920.
A beautiful memorial statue on display in New Berlin.
Elmwood Elementary School provides education in the neighborhood of New Berlin.
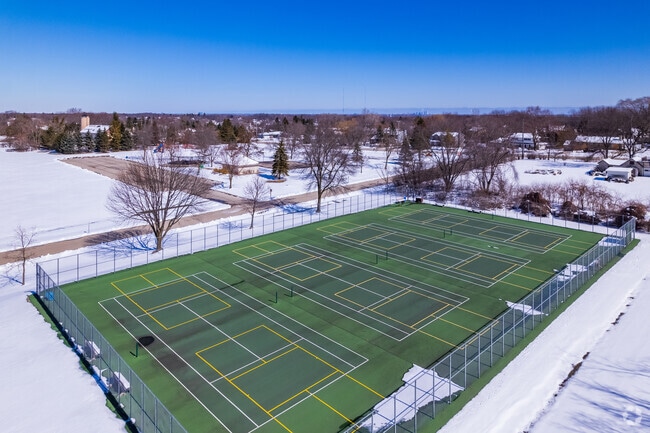
Valley View Park is an expansive park with tons of amenities for the New Berlin community.
Browse the beautiful plants at the New Berlin Farmers Market.
Median Household Income
$91,900
Average: $113,217
Education
14,908
Residents Have a Degree
Job Market
21,409
Workers Employed
Median Age
47 Years
Largest Age Group
60-69 Years
Approximately 15% of Residents
Under 20
20%
Over 65
26%
Housing Distribution
New Berlin has more homeowners than renters.

Education Distribution
Review this city's overall education levels.

As of July 2026, the average apartment rent in New Berlin, WI is $1,307 for a studio, $1,472 for one bedroom, $1,798 for two bedrooms, and $2,163 for three bedrooms. Apartment rent in New Berlin has increased by 2.8% in the past year.
Explore how walkable, bikeable, drivable, and transit-friendly New Berlin, WI is for everyday living.
Somewhat Walkable
Walkability
Exceptionally Drivable
Drivability
Somewhat Bikeable
Bikeability
Poplar Creek Elementary School
Public
Grades PK-5
514 Students

Public
Grades PK-5
476 Students
Public
Grades PK-5
570 Students

Public
Grades PK-5
567 Students
Public
Grades PK-5
464 Students
Public
Grades 6-12
1,029 Students
Public
Grades 6-12
1,029 Students
Public
Grades 6-12
1,047 Students
Public
Grades 6-12
1,047 Students
Public
Grades 6-12
1,029 Students
Public
Grades 6-12
1,029 Students
Public
Grades 6-12
1,047 Students
Public
Grades 6-12
1,047 Students
† Our analysis of utilities, groceries, transportation, healthcare, home prices, and other goods and services is sourced from the Cost of Living Index, a respected benchmark published by the Council for Community and Economic Research (C2ER) that provides a thorough overview of living expenses across different regions.
Rent data is provided by CoStar Group’s Market Trend reports. As the industry leader in commercial real estate information, analytics, and news, CoStar conducts extensive research to produce and maintain a comprehensive database of commercial real estate information. We combine this data with public record to provide the most up-to-date rental information available.
Consumer goods, services, and home prices are sourced from the Cost of Living Index published by the Council for Community and Economic Research (C2ER). The data on this page is updated quarterly. It was last published in June 2026.
Demographic information comes from Neustar and combines detailed address data with U.S. Census and American Community Survey statistics to produce reliable local estimates.


