Median Age
43 Years
Largest Age Group
30-39 Years
Approximately 14% of Residents
Under 20
20%
Over 65
25%

Avg Rent
$1,184
Population
36,000
Renter Mix
43% Rent
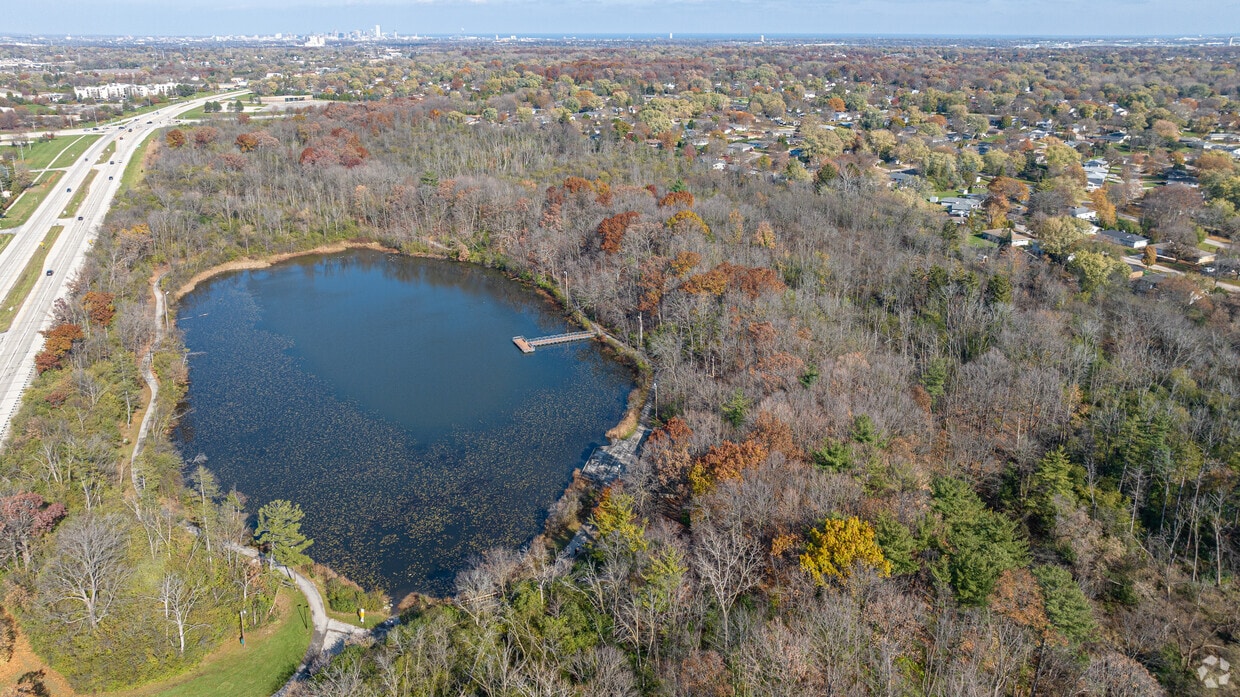
Greenfield sits just south of Milwaukee, close enough to enjoy everything the big city offers while still feeling like a place where people actually know their neighbors. Straddling Interstates 41 and 43, it’s a commuter’s dream, putting downtown Milwaukee roughly 15 minutes away. Konkel Park anchors local outdoor life with its amphitheater and a calendar packed with events like Food Truck Fridays, Movies in the Park, and the Brews and Bites Concert Series. Whitnall Park and the Boerner Botanical Gardens offer plenty of green space to explore, while Southridge Mall and a solid stretch of local dining make everyday errands easy. The Greenfield Farmers Market gives fresh, local produce a regular home throughout the season.
The rental landscape here offers solid variety, from garden-style apartment communities to spacious townhomes. Whether you want a cozy studio or a multi-bedroom layout, options exist across the city’s 12 square miles. Incorporated in 1957, Greenfield holds the distinction of being the last municipality in Milwaukee County to do so, closing out a chapter of regional growth with a community that has only continued to build on its roots ever since.
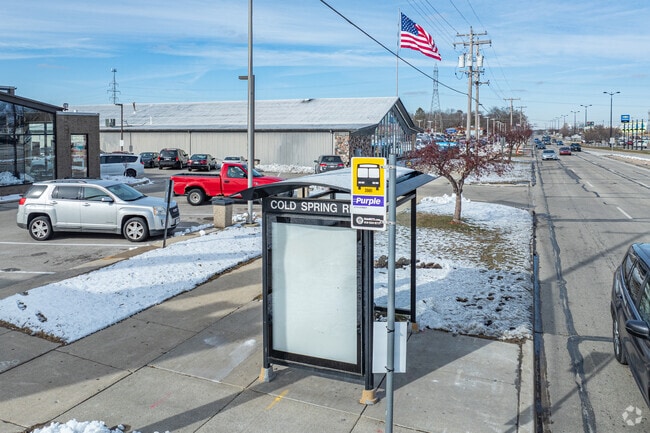
Greenfield residents can easily navigate the area using the Milwaukee Transit system.
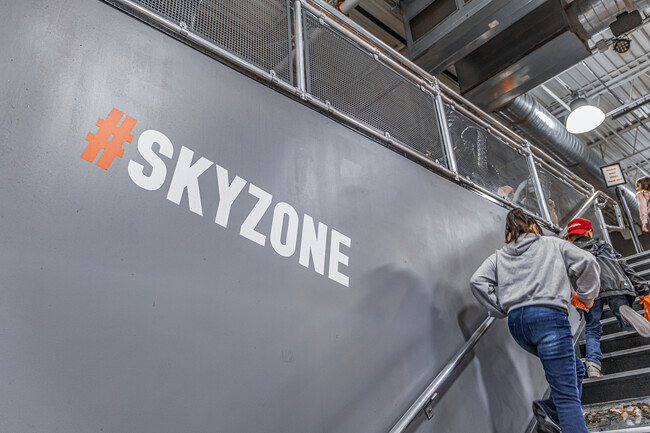
Get to Sky Zone for some indoor fun and exercise.
Median Household Income
$67,063
Average: $83,841
Education
9,382
Residents Have a Degree
Job Market
19,160
Workers Employed
Median Age
43 Years
Largest Age Group
30-39 Years
Approximately 14% of Residents
Under 20
20%
Over 65
25%
Housing Distribution
Greenfield has more homeowners than renters.

Education Distribution
Review this city's overall education levels.

As of July 2026, the average apartment rent in Greenfield, WI is $1,450 for a studio, $1,184 for one bedroom, $1,516 for two bedrooms, and $2,403 for three bedrooms. Apartment rent in Greenfield has increased by 1.8% in the past year.
Explore how walkable, bikeable, drivable, and transit-friendly Greenfield, WI is for everyday living.
Moderately Walkable
Walkability
Some Public Transit
Transit
Exceptionally Drivable
Drivability
Fairly Bikeable
Bikeability
Public
Grades PK-5
314 Students

Public
Grades PK-5
314 Students
Public
Grades PK-5
477 Students

Public
Grades PK-5
484 Students

Public
Grades PK-5
324 Students
Public
Grades 6-8
579 Students

Public
Grades 6-8
558 Students
Public
Grades 6-8
750 Students
Public
Grades 6-8
704 Students
Public
Grades 9-12
832 Students
Public
Grades 9-12
832 Students
Public
Grades 9-12
1,157 Students
Public
Grades 9-12
1,157 Students
† Our analysis of utilities, groceries, transportation, healthcare, home prices, and other goods and services is sourced from the Cost of Living Index, a respected benchmark published by the Council for Community and Economic Research (C2ER) that provides a thorough overview of living expenses across different regions.
Rent data is provided by CoStar Group’s Market Trend reports. As the industry leader in commercial real estate information, analytics, and news, CoStar conducts extensive research to produce and maintain a comprehensive database of commercial real estate information. We combine this data with public record to provide the most up-to-date rental information available.
Consumer goods, services, and home prices are sourced from the Cost of Living Index published by the Council for Community and Economic Research (C2ER). The data on this page is updated quarterly. It was last published in June 2026.
Demographic information comes from Neustar and combines detailed address data with U.S. Census and American Community Survey statistics to produce reliable local estimates.


