
IMT Laguna Niguel
26033 Cape Dr,
Laguna Niguel, CA 92677
$2,235 - $4,340
Studio - 3 Beds


Mission Viejo showcases the best of Southern California living through its thoughtfully planned community design. Tree-lined streets and Mediterranean-style architecture characterize its neighborhoods, while Lake Mission Viejo serves as a central gathering spot where members enjoy swimming, fishing, and boat rentals throughout the year. The lake also hosts popular summer concerts and lakeside movie screenings. Outdoor enthusiasts appreciate the Oso Creek Trail system, which winds through the city's parks and recreational areas.
The rental market in Mission Viejo offers options at various price points, with current average rents ranging from $2,207 for studios to $3,790 for three-bedroom homes. Rental rates have remained stable over the past year, showing changes between -1.1% and 1.1%. The city features The Shops at Mission Viejo and Kaleidoscope Center for shopping and dining, while Saddleback College brings educational opportunities to the area. Mission Hospital, a major regional medical center, provides comprehensive healthcare services. Residents have access to multiple parks, three golf courses, and community programs at the Norman P. Murray Community Center.
Explore the lakefront communities in Mission Viejo for luxury living with a view.
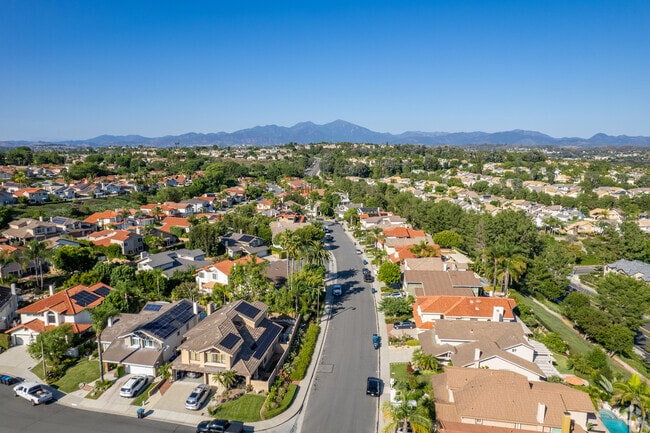
Residents living in the suburbs of Mission Viejo can enjoy beautiful mountain views.
As of March 2026, the average apartment rent in Mission Viejo, CA is $2,262 for a studio, $2,507 for one bedroom, $3,111 for two bedrooms, and $3,788 for three bedrooms. Apartment rent in Mission Viejo has increased by 1.1% in the past year.
Explore how walkable, bikeable, drivable, and transit-friendly Mission Viejo, CA is for everyday living.
Somewhat Walkable
You might be able to get out and walk when living in this area. Some errands can be accomplished on foot, but for others you’ll need a car.
Somewhat Bikeable
You might be able to find places to ride your bike in this area, but you’ll most likely want your car for most errands.
Public
Grades K-5

Public
Grades K-5
Public
Grades K-5

Public
Grades K-5
Public
Grades K-5
Oxford Preparatory Academy - South Orange County
Public
Grades K-8
Public
Grades 6-8
Public
Grades 6-8

Public
Grades 6-8

Public
Grades 6-8

Public
Grades 9-12
Public
Grades 9-12
Public
Grades 9-12
Public
Grades K-12
24 Students

Public
Grades 6-12

164
Communities
53,425
Units
74
Cities

45
Communities
10,594
Units
27
Cities

113
Communities
61,057
Units
17
Cities

457
Communities
108,184
Units
229
Cities

557
Communities
125,188
Units
221
Cities

159
Communities
26,767
Units
111
Cities
† Our analysis of utilities, groceries, transportation, healthcare, home prices, and other goods and services is sourced from the Cost of Living Index, a respected benchmark published by the Council for Community and Economic Research (C2ER) that provides a thorough overview of living expenses across different regions.
Rent data is provided by CoStar Group’s Market Trend reports. As the industry leader in commercial real estate information, analytics, and news, CoStar conducts extensive research to produce and maintain a comprehensive database of commercial real estate information. We combine this data with public record to provide the most up-to-date rental information available.
Consumer goods, services, and home prices are sourced from the Cost of Living Index published by the Council for Community and Economic Research (C2ER). The data on this page is updated quarterly. It was last published in February 2026.


