Median Age
48 Years
Largest Age Group
60-69 Years
Approximately 16% of Residents
Under 20
20%
Over 65
25%


Avg Rent
$2,820
Population
63,316
Renter Mix
32% Rent
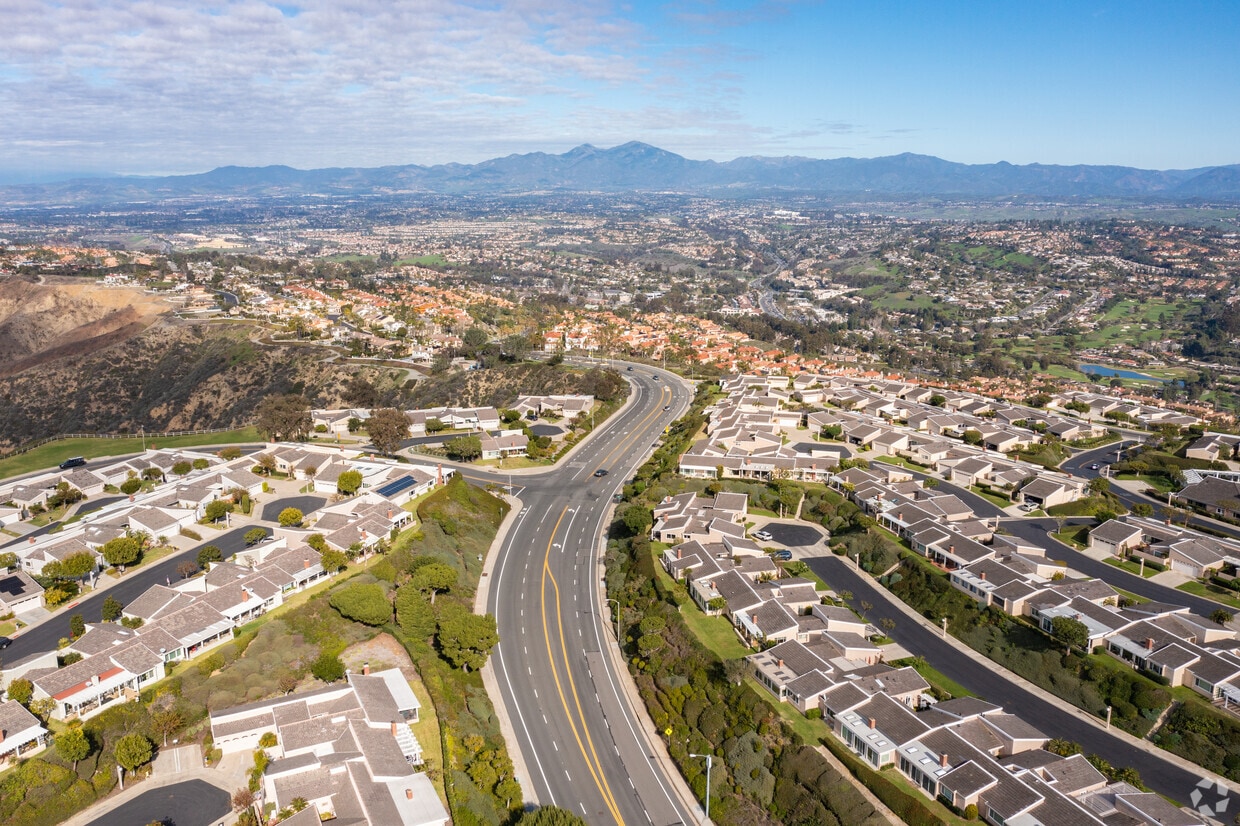
One of California’s first master-planned communities, Laguna Niguel offers luxury living with easy access to both Los Angeles and San Diego, which are each located about an hour away. Most of Laguna Niguel is made up of residential neighborhoods. Renters have choices of apartments, condos, and houses that are sure to fit almost every renter’s style.
The city is only a few miles from the coast, particularly Aliso Beach and Salt Creek Beach. Numerous golf courses and an enviable park and trail system are located within Laguna Niguel, giving residents plenty of opportunities to get outside and soak in the California sunshine. Favorite outdoor destinations within town include the Niguel Botanical Preserve and the Laguna National Regional Park. More features enjoyed by residents are great schools and premier shopping destinations. Several major colleges have campuses nearby as well.
Beautiful Golf Course in Laguna Niguel.
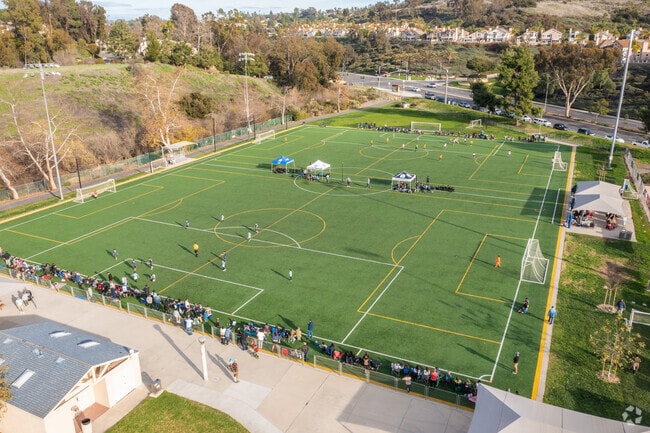
Crown Valley Park Soccer Field.
Niguel Botanical Reserve in Laguna Niguel.
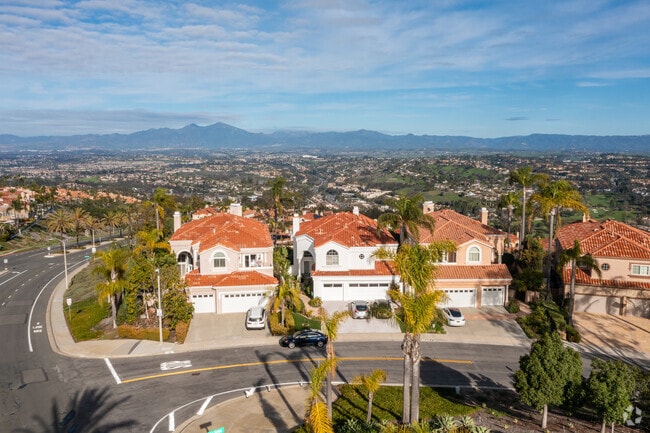
Condominiums with ocean views in Laguna Niguel.
Laguna Niguel Regional Park Lake.
There are many parks, trails and other activities to enjoy in Laguna Niguel.
Median Household Income
$132,188
Average: $157,884
Education
29,617
Residents Have a Degree
Job Market
33,662
Workers Employed
Median Age
48 Years
Largest Age Group
60-69 Years
Approximately 16% of Residents
Under 20
20%
Over 65
25%
Housing Distribution
Laguna Niguel has more homeowners than renters.

Education Distribution
Review this city's overall education levels.

As of July 2026, the average apartment rent in Laguna Niguel, CA is $2,543 for a studio, $2,823 for one bedroom, $3,336 for two bedrooms, and $4,036 for three bedrooms. Apartment rent in Laguna Niguel has increased by 4.3% in the past year.
Explore how walkable, bikeable, drivable, and transit-friendly Laguna Niguel, CA is for everyday living.
Fairly Walkable
Walkability
Limited Public Transit
Transit
Exceptionally Drivable
Drivability
Moderately Bikeable
Bikeability
Public
Grades K-5
553 Students

Public
Grades K-5
553 Students
George White Elementary School
Public
Grades K-5
378 Students
Public
Grades K-5
378 Students
Public
Grades K-8
780 Students

Public
Grades K-8
780 Students
Public
Grades 6-8
693 Students

Public
Grades 6-8
693 Students

† Our analysis of utilities, groceries, transportation, healthcare, home prices, and other goods and services is sourced from the Cost of Living Index, a respected benchmark published by the Council for Community and Economic Research (C2ER) that provides a thorough overview of living expenses across different regions.
Rent data is provided by CoStar Group’s Market Trend reports. As the industry leader in commercial real estate information, analytics, and news, CoStar conducts extensive research to produce and maintain a comprehensive database of commercial real estate information. We combine this data with public record to provide the most up-to-date rental information available.
Consumer goods, services, and home prices are sourced from the Cost of Living Index published by the Council for Community and Economic Research (C2ER). The data on this page is updated quarterly. It was last published in June 2026.
Demographic information comes from Neustar and combines detailed address data with U.S. Census and American Community Survey statistics to produce reliable local estimates.


