
Parc West
950 S Main St,
Milpitas, CA 95035
$2,550 - $2,750
1 Bed
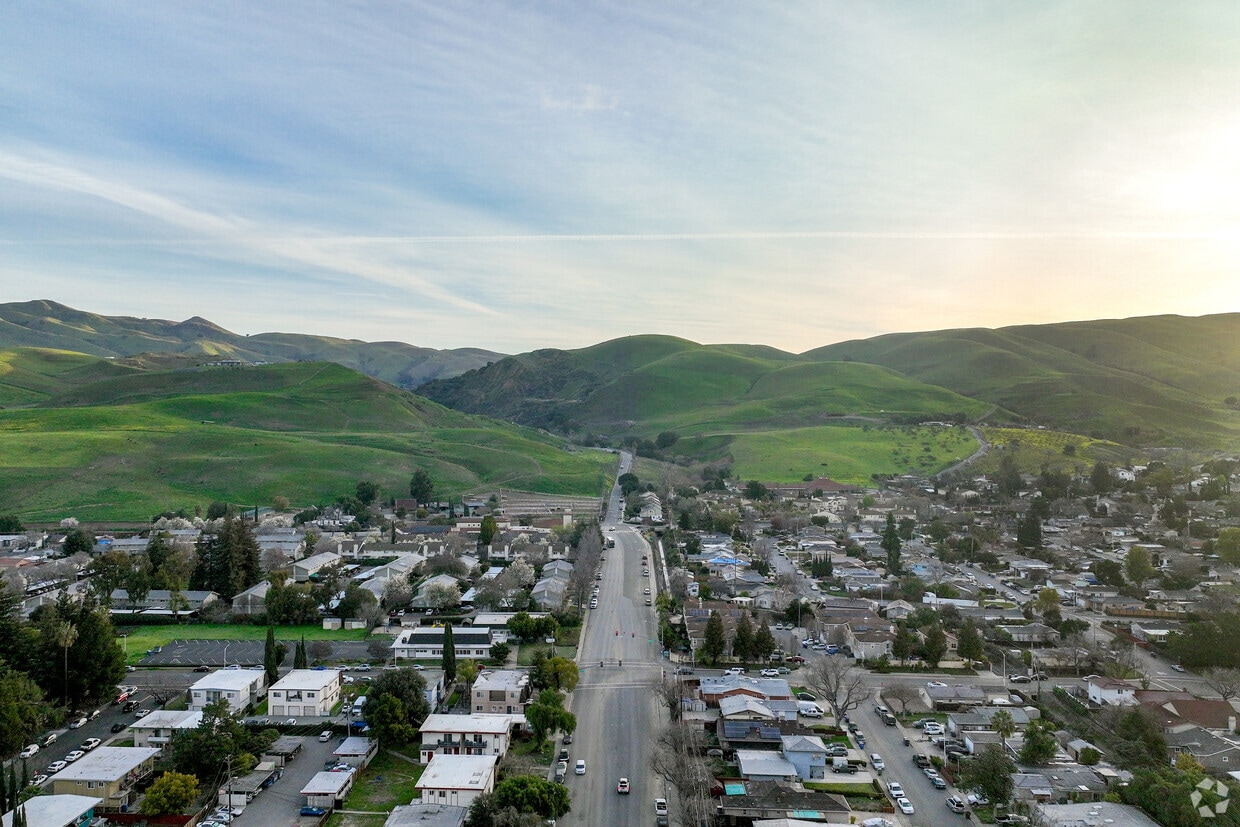
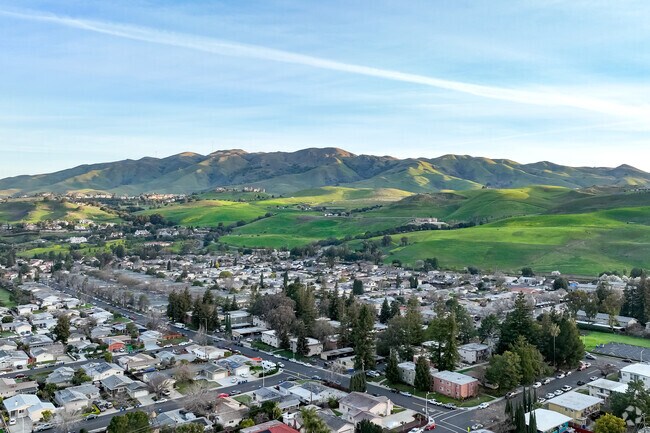
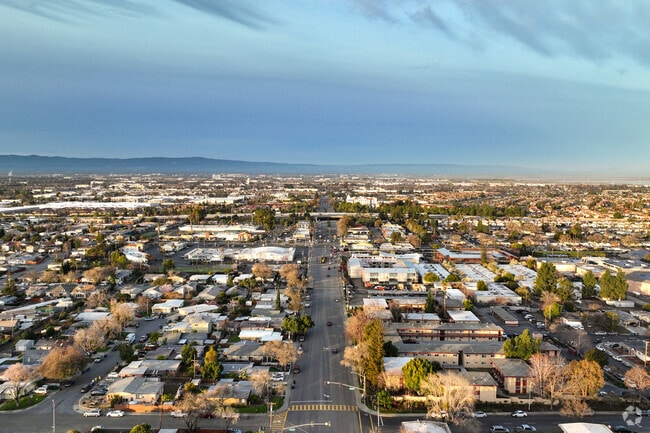

Located in the northeastern corner of Silicon Valley, Milpitas combines residential comfort with innovation. The average rent for a one-bedroom apartment is $2,822 with a 1.7% year-over-year increase. Positioned between the Diablo Range and the intersection of Interstates 680 and 880, Milpitas offers convenient access throughout Silicon Valley. The city features established areas like the Midtown district, with its mix of residential streets and local businesses, while the area near the Great Mall showcases newer residential developments.
Milpitas offers residents numerous recreational opportunities and amenities. The Great Mall of the Bay Area serves as a central shopping destination, spanning 1.3 million square feet with more than 200 retailers. Ed R. Levin County Park provides hiking trails, hang gliding areas, and panoramic views of the Santa Clara Valley. The city maintains 17 neighborhood parks and recreation facilities, including public swimming pools and sports complexes. Since its incorporation in 1954, Milpitas has evolved from agricultural roots to become part of Silicon Valley's technology corridor, with companies like Cisco Systems, KLA Corporation, and Flex maintaining operations in the area. The city made history in 1966 when Ben F. Gross was elected mayor, becoming California's first Black mayor of a predominantly white municipality.
Milpitas is a tight-knit community that is known for its stock of medium sized homes.
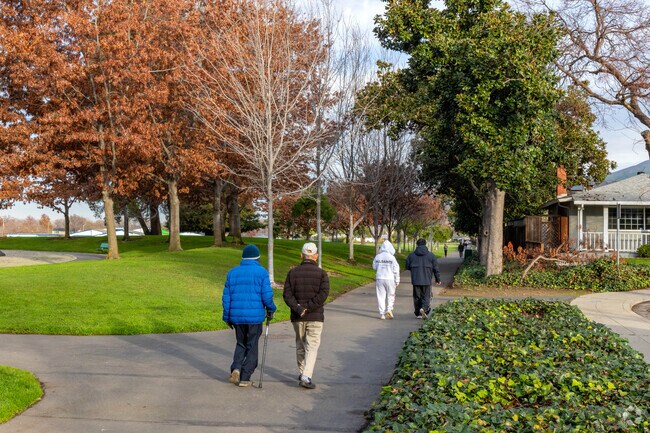
Roads in Milpitas residential neighborhoods are bordered by sidewalks.
Play a leisurely game of tennis at Robert E. Brown Park in Milpitas.
Walk along the many walking paths in Robert E. Brown Park in Milpitas.
Admire the beautiful landscape on a drive through Milpitas.
Robert E. Browne Park has one of the best trails in Milpitas.
As of March 2026, the average apartment rent in Milpitas, CA is $2,787 for a studio, $2,956 for one bedroom, $3,557 for two bedrooms, and $3,960 for three bedrooms. Apartment rent in Milpitas has increased by 3.1% in the past year.
Explore how walkable, bikeable, drivable, and transit-friendly Milpitas, CA is for everyday living.
Somewhat Walkable
You might be able to get out and walk when living in this area. Some errands can be accomplished on foot, but for others you’ll need a car.
Some Transit
You'll likely want a car when living in this area since it has few transit options.
Bikeable
While there’s some bike infrastructure in this area, you’ll still need a car for many errands.
Public
Grades K-5

Public
Grades K-5
Public
Grades K-5

Public
Grades K-5

Public
Grades K-5
Public
Grades 6-8
Public
Grades 6-8
Public
Grades 9-12

35
Communities
7,724
Units
25
Cities

3,486
Communities
958,770
Units
894
Cities

104
Communities
29,578
Units
64
Cities

107
Communities
37,535
Units
58
Cities

113
Communities
61,057
Units
17
Cities

715
Communities
198,674
Units
340
Cities
† Our analysis of utilities, groceries, transportation, healthcare, home prices, and other goods and services is sourced from the Cost of Living Index, a respected benchmark published by the Council for Community and Economic Research (C2ER) that provides a thorough overview of living expenses across different regions.
Rent data is provided by CoStar Group’s Market Trend reports. As the industry leader in commercial real estate information, analytics, and news, CoStar conducts extensive research to produce and maintain a comprehensive database of commercial real estate information. We combine this data with public record to provide the most up-to-date rental information available.
Consumer goods, services, and home prices are sourced from the Cost of Living Index published by the Council for Community and Economic Research (C2ER). The data on this page is updated quarterly. It was last published in February 2026.


