Median Age
40 Years
Largest Age Group
30-39 Years
Approximately 13% of Residents
Under 20
24%
Over 65
20%

Avg Rent
$1,100
Population
44,309
Renter Mix
43% Rent
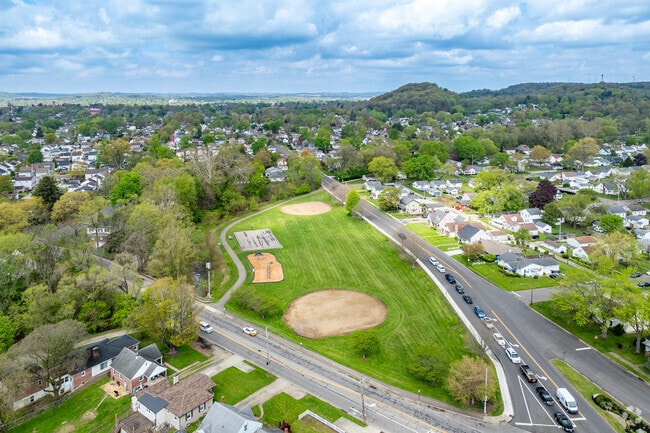
Located in south-central Ohio, Lancaster sits approximately 33 miles southeast of Columbus, offering a mix of historic architecture and contemporary living options. With approximately 40,500 residents, this former "Glass City" maintains strong connections to its manufacturing heritage. The rental market reflects steady growth, with one-bedroom apartments averaging $1,031, two-bedroom units at $1,241, and three-bedroom homes typically renting for $1,557.
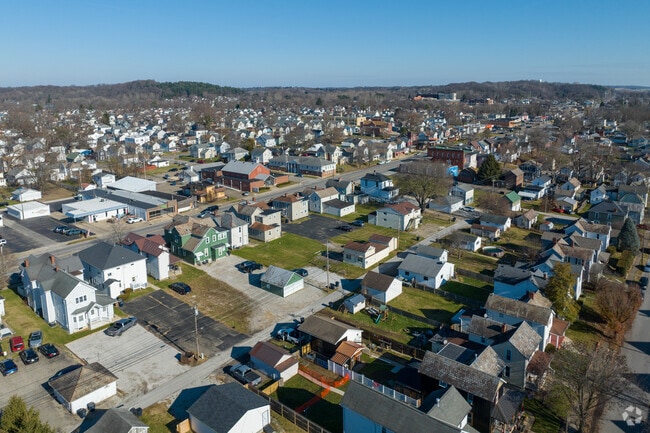
Lancaster's downtown district preserves its historic character along Main Street, where locally-owned businesses occupy beautifully maintained buildings. The city's outdoor spaces include Rising Park, featuring dramatic sandstone cliffs and panoramic views of the valley. Ohio University-Lancaster's campus adds educational resources to the community, while the Decorative Arts Center of Ohio and Ohio Glass Museum showcase the area's artistic heritage. Each October, the Fairfield County Fair - Ohio's last county fair of the season - continues a cherished tradition dating back to 1851. From historic districts featuring preserved Georgian architecture to contemporary apartment communities, Lancaster offers diverse rental options with easy access to parks, shopping, and dining destinations.
The houses were developed very close to the tree- and sidewalk-lined streets.
Median Household Income
$56,334
Average: $69,792
Education
8,453
Residents Have a Degree
Job Market
20,663
Workers Employed
Median Age
40 Years
Largest Age Group
30-39 Years
Approximately 13% of Residents
Under 20
24%
Over 65
20%
Housing Distribution
Lancaster has more homeowners than renters.

Education Distribution
Review this city's overall education levels.

As of July 2026, the average apartment rent in Lancaster, OH is $978 for a studio, $1,100 for one bedroom, $1,310 for two bedrooms, and $1,901 for three bedrooms. Apartment rent in Lancaster has increased by 2.0% in the past year.
Explore how walkable, bikeable, drivable, and transit-friendly Lancaster, OH is for everyday living.
Moderately Walkable
Walkability
Limited Public Transit
Transit
Exceptionally Drivable
Drivability
Fairly Bikeable
Bikeability
Public
Grades K-5
606 Students

Fairfield Union Rushville Middle School
Public
Grades K-8
605 Students
Public
Grades K-5
293 Students
Public
Grades K-5
535 Students

Cedar Heights Elementary School
Public
Grades K-5
525 Students
Fairfield Union Rushville Middle School
Public
Grades K-8
605 Students
General Sherman Junior High School
Public
Grades 6-8
686 Students

Thomas Ewing Junior High School
Public
Grades 6-8
632 Students
Public
Grades 9-12
551 Students
Public
Grades 9-12
1,838 Students

† Our analysis of utilities, groceries, transportation, healthcare, home prices, and other goods and services is sourced from the Cost of Living Index, a respected benchmark published by the Council for Community and Economic Research (C2ER) that provides a thorough overview of living expenses across different regions.
Rent data is provided by CoStar Group’s Market Trend reports. As the industry leader in commercial real estate information, analytics, and news, CoStar conducts extensive research to produce and maintain a comprehensive database of commercial real estate information. We combine this data with public record to provide the most up-to-date rental information available.
Consumer goods, services, and home prices are sourced from the Cost of Living Index published by the Council for Community and Economic Research (C2ER). The data on this page is updated quarterly. It was last published in June 2026.
Demographic information comes from Neustar and combines detailed address data with U.S. Census and American Community Survey statistics to produce reliable local estimates.


