Median Age
40 Years
Largest Age Group
30-39 Years
Approximately 14% of Residents
Under 20
23%
Over 65
21%
Avg Rent
$977
Population
54,165
Renter Mix
39% Rent
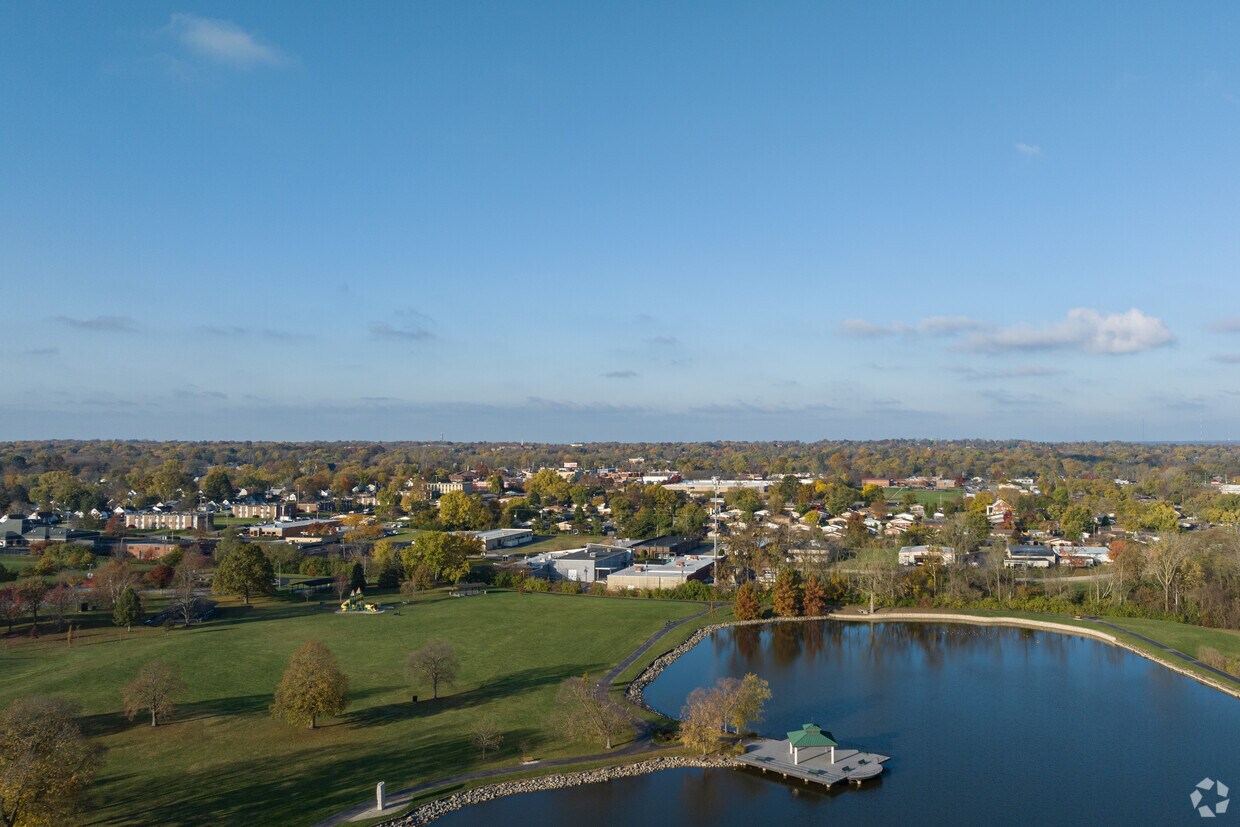
Kettering is a large suburban community on the south side of Dayton. Primarily made up of residential neighborhoods, Kettering boasts a family-friendly environment with high-performing public schools and one of the lowest crime rates in the area while also maintaining numerous budget-friendly options across the city’s diverse rental market.
The small Kettering College serves just over 700 students at its campus on the west side, and the University of Dayton sits just north of the city limits. Locals enjoy a wide selection of outdoor recreation options, with golf courses, public parks, and even a 40,000 square foot skate plaza.
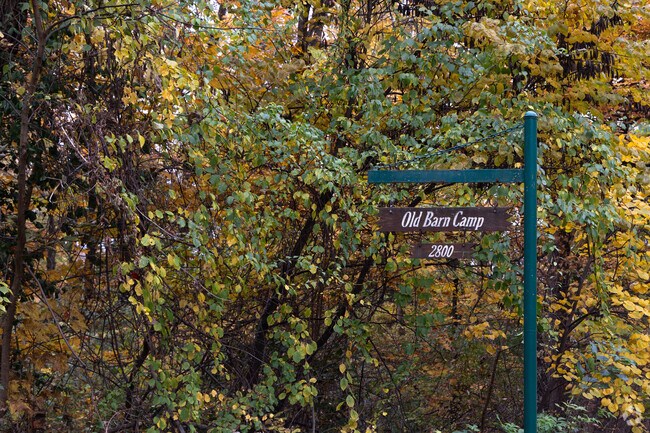
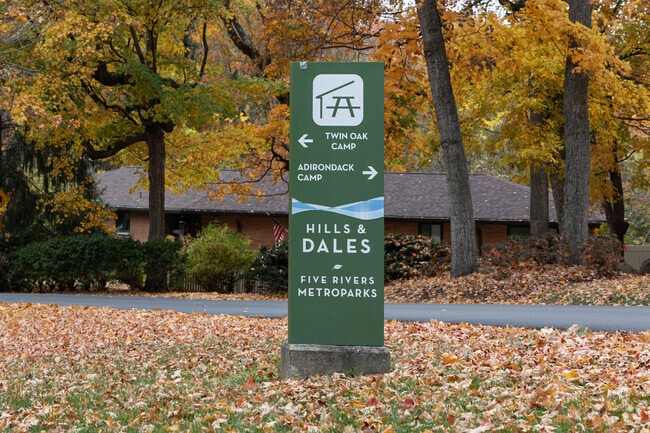
Twin Oak Camp is part of the Hills & Dales Metroparks and provides access to the main trail.
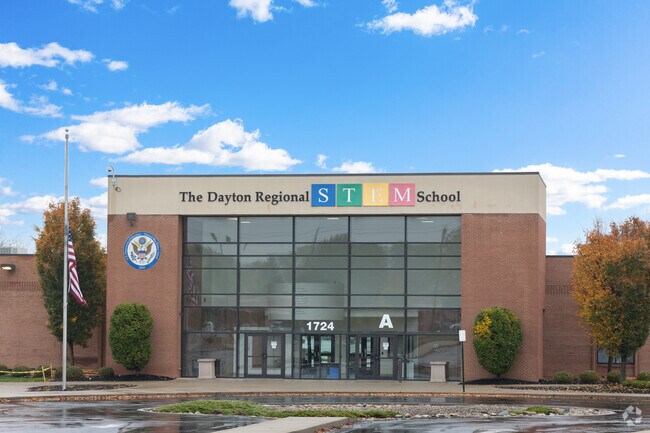
The Dayton Regional STEM School aims to prepare and inspire the next generation of leaders.
St. Albert The Great School is a private, Catholic School for grades PK, and K-8.
Oakwood Junior High School is a top rated school for grades 7-8.
Van Buren Village Park is located between the Van Buren Village apartments.
State Farm Park is located in a Kettering neighborhood and has six baseball fields.
Median Household Income
$67,316
Average: $83,513
Education
17,101
Residents Have a Degree
Job Market
28,060
Workers Employed
Median Age
40 Years
Largest Age Group
30-39 Years
Approximately 14% of Residents
Under 20
23%
Over 65
21%
Housing Distribution
Kettering has more homeowners than renters.

Education Distribution
Review this city's overall education levels.

As of July 2026, the average apartment rent in Kettering, OH is $505 for a studio, $977 for one bedroom, $1,188 for two bedrooms, and $1,429 for three bedrooms. Apartment rent in Kettering has increased by 3.7% in the past year.
Explore how walkable, bikeable, drivable, and transit-friendly Kettering, OH is for everyday living.
Fairly Walkable
Walkability
Limited Public Transit
Transit
Moderately Drivable
Drivability
Fairly Bikeable
Bikeability
Public
Grades PK-5
473 Students

Public
Grades K-5
427 Students
Public
Grades PK-5
599 Students

Public
Grades K-5
528 Students
Indian Riffle Elementary School
Public
Grades PK-5
518 Students
Public
Grades 6-12
773 Students
Public
Grades 6-8
595 Students
Public
Grades 6-8
978 Students

Public
Grades 6-12
773 Students
Kettering Fairmont High School
Public
Grades 9-12
2,376 Students
† Our analysis of utilities, groceries, transportation, healthcare, home prices, and other goods and services is sourced from the Cost of Living Index, a respected benchmark published by the Council for Community and Economic Research (C2ER) that provides a thorough overview of living expenses across different regions.
Rent data is provided by CoStar Group’s Market Trend reports. As the industry leader in commercial real estate information, analytics, and news, CoStar conducts extensive research to produce and maintain a comprehensive database of commercial real estate information. We combine this data with public record to provide the most up-to-date rental information available.
Consumer goods, services, and home prices are sourced from the Cost of Living Index published by the Council for Community and Economic Research (C2ER). The data on this page is updated quarterly. It was last published in June 2026.
Demographic information comes from Neustar and combines detailed address data with U.S. Census and American Community Survey statistics to produce reliable local estimates.


