Median Age
36 Years
Largest Age Group
5-14 Years
Approximately 14% of Residents
Under 20
28%
Over 65
16%


Avg Rent
$1,316
Population
89,365
Renter Mix
38% Rent
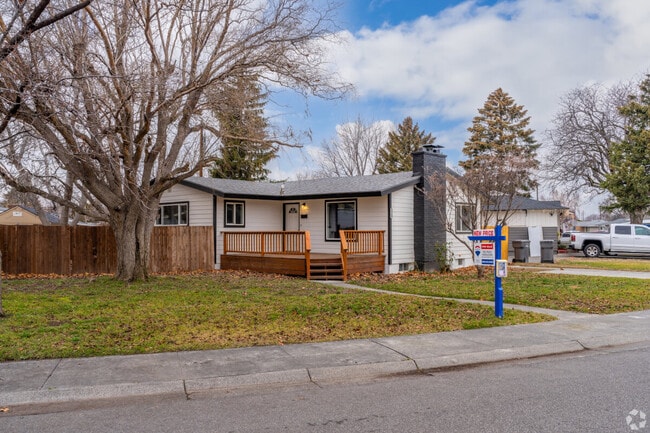
Welcome to Kennewick, situated along the Columbia River in southeastern Washington. This growing community offers varied housing options throughout its neighborhoods, from newer developments in the Southridge district to established homes near downtown. One-bedroom apartments average $1,295 per month, while two-bedroom units average $1,537. The city spans 28 square miles and benefits from abundant sunshine, with Columbia Park serving as a cornerstone of outdoor recreation. The park features boat launches, walking trails, and an 18-hole golf course along the riverfront.
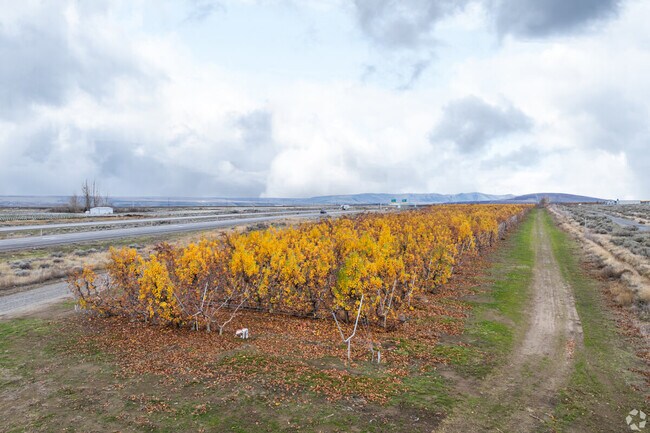
Kennewick balances everyday conveniences with community character, centered around Columbia Center Mall, the largest shopping complex in the region. The Southridge area continues to grow, anchored by the Toyota Center, home to the Tri-City Americans hockey team. Local landmarks include the Clover Island lighthouse and the Southridge Sports Complex, which houses a memorial dedicated to the events of September 11. The area's agricultural heritage comes to life through the surrounding vineyards, with several established wineries and tasting rooms throughout the region. Residents enjoy access to multiple parks and the Sacagawea Heritage Trail, which winds along the Columbia River.
You can find homes spanning a wide price range in Kennewick.
Kennewick offers lots of activities to do on the Columbia River.
Wine production and other agriculture is a large part of the city of Kennewick.
Median Household Income
$66,627
Average: $89,733
Education
19,346
Residents Have a Degree
Job Market
40,156
Workers Employed
Median Age
36 Years
Largest Age Group
5-14 Years
Approximately 14% of Residents
Under 20
28%
Over 65
16%
Housing Distribution
Kennewick has more homeowners than renters.

Education Distribution
Review this city's overall education levels.

As of July 2026, the average apartment rent in Kennewick, WA is $1,093 for a studio, $1,316 for one bedroom, $1,506 for two bedrooms, and $1,751 for three bedrooms. Apartment rent in Kennewick has increased by 2.6% in the past year.
The cost of living in Kennewick, WA is 4.5% lower than the national average. Generally, housing in Kennewick is 15.9% less expensive than the national average, with rent falling between $1,093 - $1,751. You can expect to pay 5.6% more for groceries, 18.4% less for utilities, and 19.3% more for transportation.
Compare Cities
Explore how walkable, bikeable, drivable, and transit-friendly Kennewick, WA is for everyday living.
Fairly Walkable
Walkability
Limited Public Transit
Transit
Exceptionally Drivable
Drivability
Fairly Bikeable
Bikeability
Public
Grades K-5
525 Students

Public
Grades K-5
455 Students
Public
Grades K-5
334 Students
Public
Grades PK-5
426 Students

Public
Grades K-5
406 Students
Public
Grades 6-8
930 Students

Public
Grades 6-8
889 Students

Public
Grades 6-8
692 Students
Horse Heaven Hills Middle School
Public
Grades 6-8
833 Students

Public
Grades 6-8
216 Students
Public
Grades 9-12
1,884 Students
Public
Grades 9-12
1,641 Students
Public
Grades 9-12
1,864 Students

Public
Grades 9-12
313 Students
Public
Grades 9-12
629 Students

† Our analysis of utilities, groceries, transportation, healthcare, home prices, and other goods and services is sourced from the Cost of Living Index, a respected benchmark published by the Council for Community and Economic Research (C2ER) that provides a thorough overview of living expenses across different regions.
Rent data is provided by CoStar Group’s Market Trend reports. As the industry leader in commercial real estate information, analytics, and news, CoStar conducts extensive research to produce and maintain a comprehensive database of commercial real estate information. We combine this data with public record to provide the most up-to-date rental information available.
Consumer goods, services, and home prices are sourced from the Cost of Living Index published by the Council for Community and Economic Research (C2ER). The data on this page is updated quarterly. It was last published in June 2026.
Demographic information comes from Neustar and combines detailed address data with U.S. Census and American Community Survey statistics to produce reliable local estimates.


