Median Age
39 Years
Largest Age Group
30-39 Years
Approximately 14% of Residents
Under 20
25%
Over 65
19%

Avg Rent
$1,397
Population
62,775
Renter Mix
36% Rent
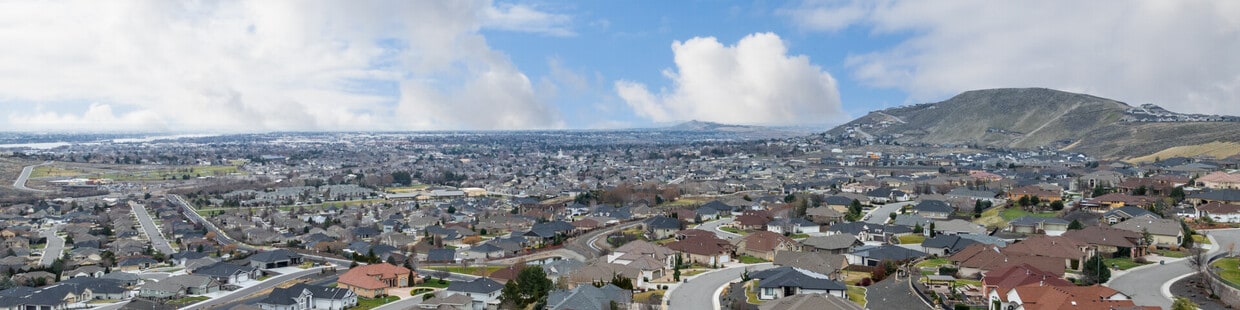
Located at the meeting point of the Columbia and Yakima Rivers, Richland combines outdoor recreation with scientific innovation. This riverside community, historically significant for its role in the Manhattan Project, has grown into a center for research and outdoor activities. Residents enjoy the 23-mile Sacagawea Heritage Trail for cycling and walking along the river. Howard Amon Park provides waterfront recreation, while the surrounding Columbia Valley wine region offers numerous tasting rooms and vineyards. The Washington State University Tri-Cities campus adds to the community's educational landscape from its location along the Columbia River.
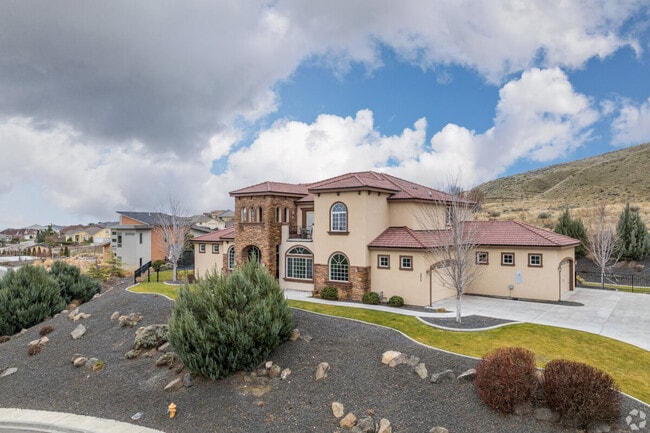
Richland's rental market shows steady growth, with current rents ranging from $1,182 for studios to $2,330 for four-bedroom homes, while one-bedroom units average $1,344 monthly. Notable areas include the Gold Coast district, featuring preserved mid-century architecture, and the Queensgate neighborhood, home to shopping centers and newer residential developments. The Pacific Northwest National Laboratory continues the city's research tradition, while the REACH Museum showcases regional history and natural science. The community spirit shows in unexpected ways, like the Richland High School's distinctive Bombers mascot and mushroom cloud logo, reflecting the area's atomic legacy. Residents enjoy easy access to golf courses, waterfront parks, and a downtown area filled with local businesses.
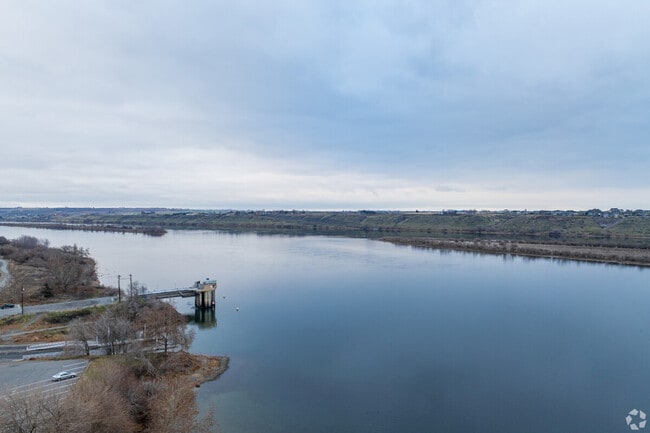
Richland offers quick access to the Columbia river for locals to enjoy.
There are many new construction communities being planned in Richland.
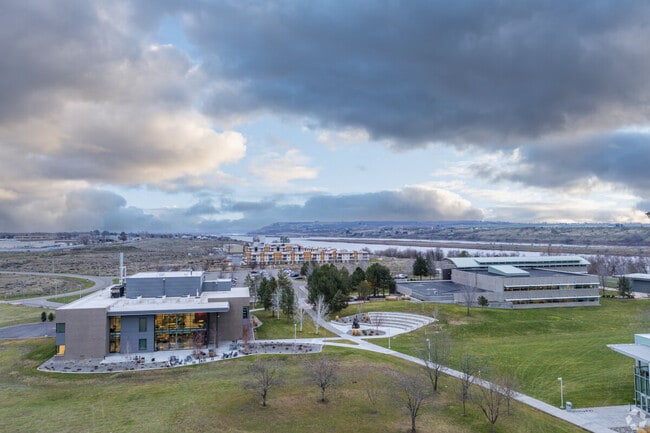
Richland features one of the WSU satellite campuses.
Median Household Income
$91,964
Average: $117,826
Education
21,764
Residents Have a Degree
Job Market
30,679
Workers Employed
Median Age
39 Years
Largest Age Group
30-39 Years
Approximately 14% of Residents
Under 20
25%
Over 65
19%
Housing Distribution
Richland has more homeowners than renters.

Education Distribution
Review this city's overall education levels.

As of July 2026, the average apartment rent in Richland, WA is $1,152 for a studio, $1,395 for one bedroom, $1,648 for two bedrooms, and $2,025 for three bedrooms. Apartment rent in Richland has decreased by -0.7% in the past year.
The cost of living in Richland, WA is 4.5% lower than the national average. Generally, housing in Richland is 15.9% less expensive than the national average, with rent falling between $1,152 - $2,025. You can expect to pay 5.6% more for groceries, 18.4% less for utilities, and 19.3% more for transportation.
Compare Cities
Explore how walkable, bikeable, drivable, and transit-friendly Richland, WA is for everyday living.
Somewhat Walkable
Walkability
Minimal Public Transit
Transit
Exceptionally Drivable
Drivability
Somewhat Bikeable
Bikeability
White Bluffs Elementary School
Public
Grades PK-5
629 Students

Public
Grades PK-5
616 Students
Public
Grades K-5
484 Students
Marcus Whitman Elementary School
Public
Grades K-5
484 Students
Lewis & Clark Elementary School
Public
Grades PK-5
443 Students
Public
Grades K-12
767 Students

Public
Grades 6-8
807 Students

Public
Grades 6-8
677 Students
Public
Grades 9-12
1,932 Students
Public
Grades 9-12
2,137 Students
Public
Grades K-12
767 Students
Public
Grades 9-12
284 Students

Public
Grades 9-12
† Our analysis of utilities, groceries, transportation, healthcare, home prices, and other goods and services is sourced from the Cost of Living Index, a respected benchmark published by the Council for Community and Economic Research (C2ER) that provides a thorough overview of living expenses across different regions.
Rent data is provided by CoStar Group’s Market Trend reports. As the industry leader in commercial real estate information, analytics, and news, CoStar conducts extensive research to produce and maintain a comprehensive database of commercial real estate information. We combine this data with public record to provide the most up-to-date rental information available.
Consumer goods, services, and home prices are sourced from the Cost of Living Index published by the Council for Community and Economic Research (C2ER). The data on this page is updated quarterly. It was last published in June 2026.
Demographic information comes from Neustar and combines detailed address data with U.S. Census and American Community Survey statistics to produce reliable local estimates.


