Median Age
34 Years
Largest Age Group
25-34 Years
Approximately 15% of Residents
Under 20
29%
Over 65
14%

Avg Rent
$1,114
Population
9,628
Renter Mix
38% Rent
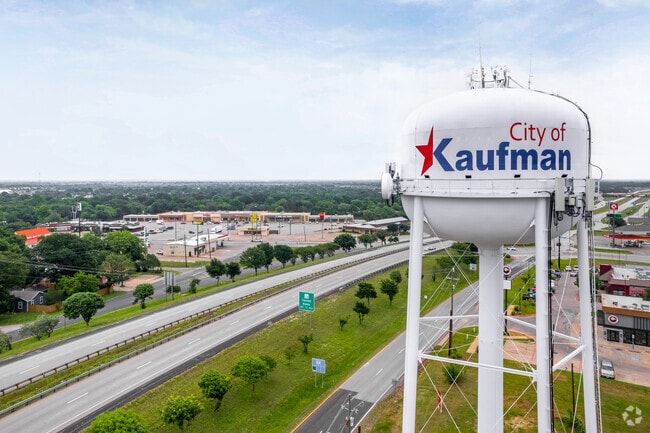
The city of Kaufman was originally founded as a fort in the 1840s. Served by the Kaufman Independent School District, the city is growing with families. And speaking of schools, Trinity Valley Community College also calls this area home.
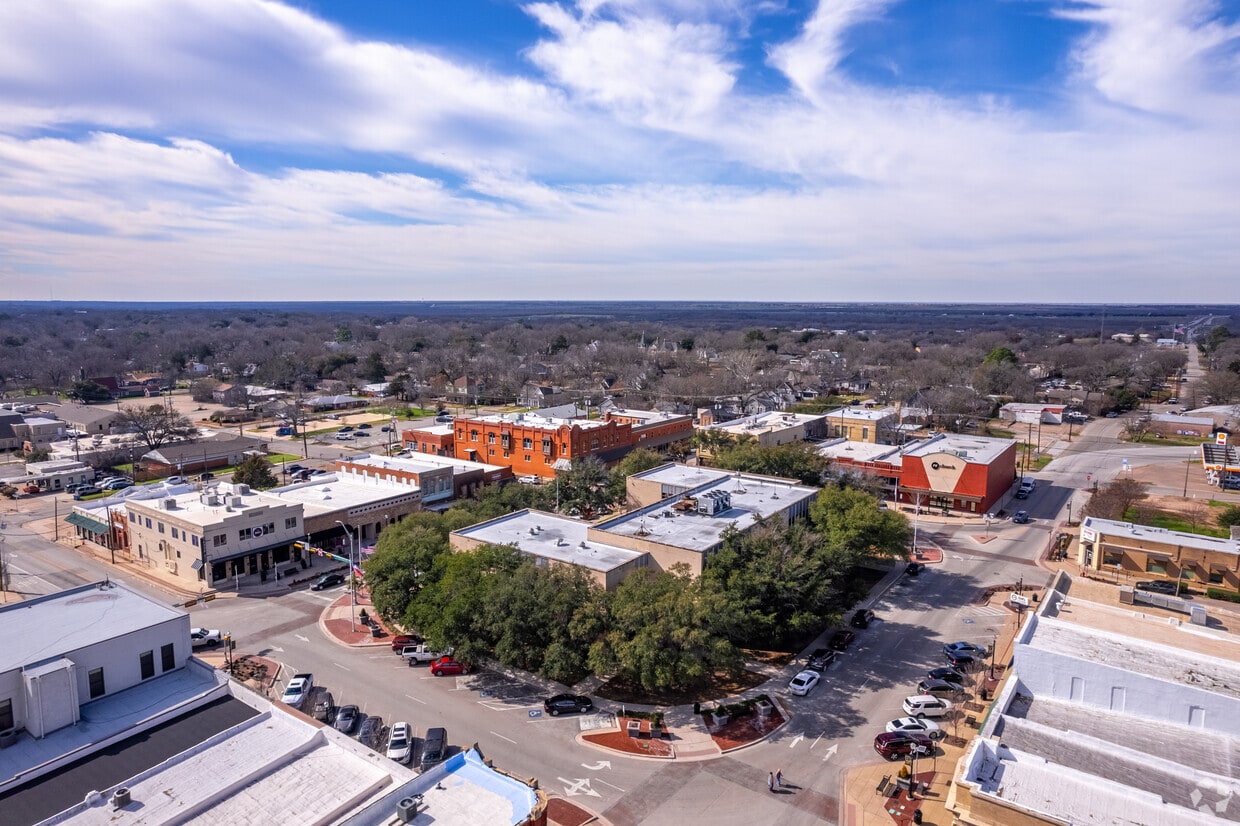
Downtown Kaufman has exactly the Old West-style most come to expect from a Texas community. It’s encompassed with local eateries, businesses, and accessory shops, so you’ll never have to travel far for the necessities. In addition to their apartment homes, residents enjoy strolling Shannon Park, playing games at the sports complex, and visiting the historic farm. Kaufman is 40 minutes from Downtown Dallas on US-175.
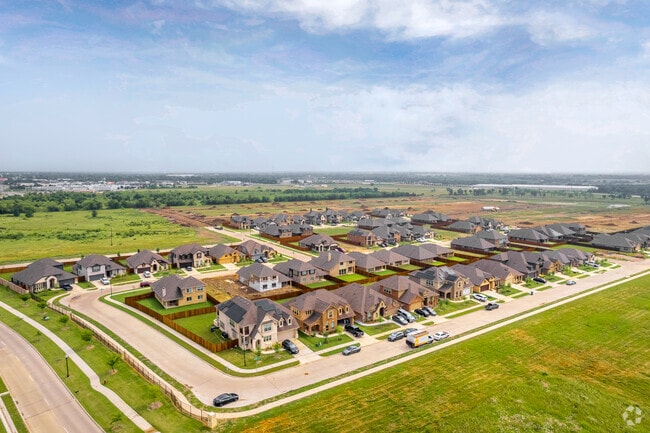
Scenic overview of homes in the south side of Kaufman, TX.
If you like fishing, boating, or hiking, then Kaufman City Lake Park is for you.
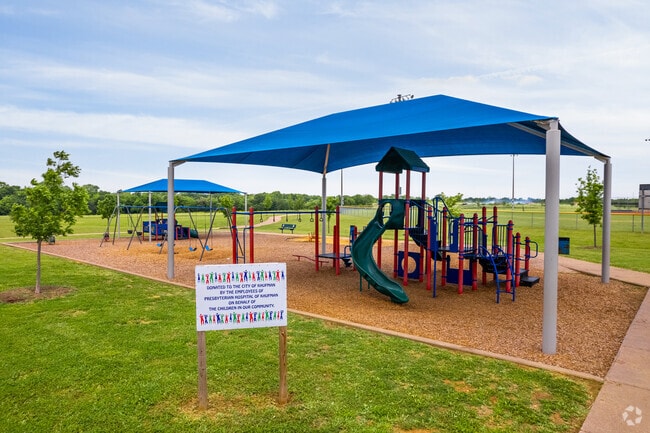
A playground area is located next to the covered pavilion at the Kaufman Sports Complex.
Explore all downtown Kaufman has to offer with different shops and restaurants.
Kaufman City Lake Park is where locals come to fish outside Kaufman city limits.
Kaufman's downtown square is a central gathering place for locals and visitors alike.
Median Household Income
$60,444
Average: $79,063
Education
1,218
Residents Have a Degree
Job Market
4,813
Workers Employed
Median Age
34 Years
Largest Age Group
25-34 Years
Approximately 15% of Residents
Under 20
29%
Over 65
14%
Housing Distribution
Kaufman has more homeowners than renters.

Education Distribution
Review this city's overall education levels.

As of July 2026, the average apartment rent in Kaufman, TX is $1,122 for one bedroom, $1,328 for two bedrooms, and $1,777 for three bedrooms. Apartment rent in Kaufman has increased by 0.8% in the past year.
Explore how walkable, bikeable, drivable, and transit-friendly Kaufman, TX is for everyday living.
Not Walkable
Walkability
Exceptionally Drivable
Drivability
Somewhat Bikeable
Bikeability
Public
Grades K-5
512 Students

Lucille Nash Elementary School
Public
Grades K-5
604 Students

Public
603 Students

Lucille Nash Intermediate School
Public
Grades 5-6
596 Students
Public
512 Students
Public
Grades 6-8
989 Students
Public
603 Students
Public
512 Students
Public
Grades 9-12
1,292 Students
Public
Grades 9-12
13 Students

Public
603 Students
Public
512 Students
† Our analysis of utilities, groceries, transportation, healthcare, home prices, and other goods and services is sourced from the Cost of Living Index, a respected benchmark published by the Council for Community and Economic Research (C2ER) that provides a thorough overview of living expenses across different regions.
Rent data is provided by CoStar Group’s Market Trend reports. As the industry leader in commercial real estate information, analytics, and news, CoStar conducts extensive research to produce and maintain a comprehensive database of commercial real estate information. We combine this data with public record to provide the most up-to-date rental information available.
Consumer goods, services, and home prices are sourced from the Cost of Living Index published by the Council for Community and Economic Research (C2ER). The data on this page is updated quarterly. It was last published in June 2026.
Demographic information comes from Neustar and combines detailed address data with U.S. Census and American Community Survey statistics to produce reliable local estimates.


