Median Age
46 Years
Largest Age Group
60-69 Years
Approximately 15% of Residents
Under 20
21%
Over 65
24%


Avg Rent
$1,089
Population
15,837
Renter Mix
33% Rent
Perched at the point where the Susquehanna River meets the upper reaches of Chesapeake Bay, Havre de Grace carries a sense of history that runs as deep as the water surrounding it. General Lafayette reportedly compared the area to a French harbor town during the Revolutionary War, and the name stuck: Havre de Grace, or “Harbor of Grace.” That storied past is woven into every block of this small but spirited Harford County city.
Life here moves at a measured pace, anchored by a walkable Downtown district near the waterfront where locally owned shops, art galleries, and coffeehouses give the area its distinct character. Nearby Aberdeen Proving Ground is a significant economic presence in the region, and the city’s position just minutes from the Pennsylvania and Delaware borders makes it a practical home base for those who commute across state lines. Baltimore and Philadelphia are both within easy driving distance, putting major employment and cultural centers well within reach.
The housing mix reflects the city’s range of personalities, from historic rowhouses and restored craftsman-style homes to contemporary apartment communities and waterfront condos. Renters will find townhome-style units and traditional garden-style communities tucked throughout the city’s compact six square miles. Smithsonian magazine recognized Havre de Grace as one of the 20 best small towns in the country to visit, and for those who choose to stay, it’s easy to understand why.
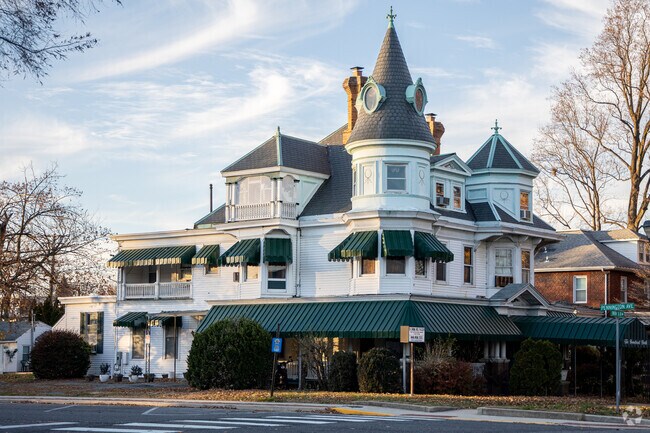
This expansive Queen Anne Victorian home in Havre De Grace has been made into small offices.
Colorful murals adorn walls throughout downtown Havre De Grace.
A statue of General Marquis de Lafayette sits in the town square in Havre De Grace.
Enjoy the local boutiques or grab some lunch along N Washington St in Havre De Grace.
Spend your afternoon at the Havre De Grace Maritime Museum.
The Cultural Center at the Opera House in Havre De Grace is newly restored.
Median Household Income
$89,978
Average: $116,372
Education
5,427
Residents Have a Degree
Job Market
8,688
Workers Employed
Median Age
46 Years
Largest Age Group
60-69 Years
Approximately 15% of Residents
Under 20
21%
Over 65
24%
Housing Distribution
Havre De Grace has more homeowners than renters.

Education Distribution
Review this city's overall education levels.

As of July 2026, the average apartment rent in Havre De Grace, MD is $731 for a studio, $1,089 for one bedroom, $1,456 for two bedrooms, and $1,664 for three bedrooms. Apartment rent in Havre De Grace has increased by 1.2% in the past year.
Explore how walkable, bikeable, drivable, and transit-friendly Havre De Grace, MD is for everyday living.
Somewhat Walkable
Walkability
Exceptionally Drivable
Drivability
Fairly Bikeable
Bikeability
Public
Grades PK-5
442 Students

Roye-Williams Elementary School
Public
Grades PK-5
442 Students
Havre De Grace Elementary School
Public
Grades PK-5
566 Students

Public
Grades PK-5
566 Students
Public
Grades PK-5
552 Students
Public
Grades 6-8
617 Students

Public
Grades 9-12
822 Students
† Our analysis of utilities, groceries, transportation, healthcare, home prices, and other goods and services is sourced from the Cost of Living Index, a respected benchmark published by the Council for Community and Economic Research (C2ER) that provides a thorough overview of living expenses across different regions.
Rent data is provided by CoStar Group’s Market Trend reports. As the industry leader in commercial real estate information, analytics, and news, CoStar conducts extensive research to produce and maintain a comprehensive database of commercial real estate information. We combine this data with public record to provide the most up-to-date rental information available.
Consumer goods, services, and home prices are sourced from the Cost of Living Index published by the Council for Community and Economic Research (C2ER). The data on this page is updated quarterly. It was last published in June 2026.
Demographic information comes from Neustar and combines detailed address data with U.S. Census and American Community Survey statistics to produce reliable local estimates.


