Median Age
35 Years
Largest Age Group
25-34 Years
Approximately 16% of Residents
Under 20
27%
Over 65
13%
Avg Rent
$1,161
Population
46,714
Renter Mix
48% Rent
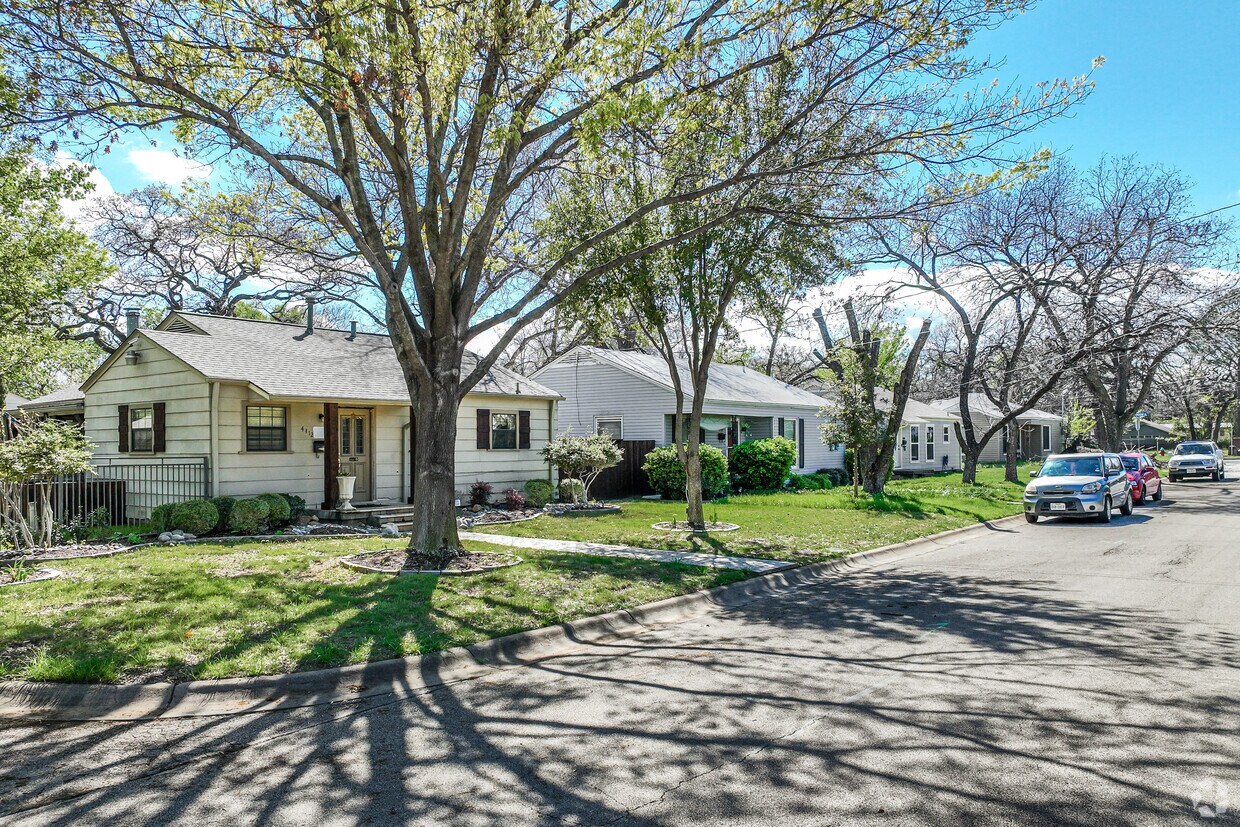
Tucked just five miles northeast of downtown Fort Worth, Haltom City puts the entire DFW Metroplex within easy reach without the big-city price tag. Major highways like I-820 and I-35W make commuting straightforward, whether you're heading into Fort Worth's bustling Stockyards District or making the 30-mile drive to Dallas. Locally, Belknap Street offers solid everyday shopping, while Buffalo Ridge Park—a sprawling 95-acre green space—delivers hiking trails, playgrounds, and picnic areas for anyone who likes to spend time outdoors. The nearby Diamond Oaks Country Club Golf Course adds a quieter option for weekend leisure.
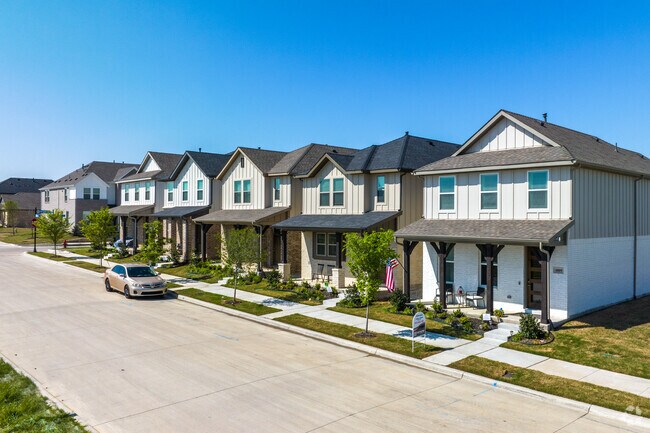
The rental landscape here leans toward traditional apartment communities and townhomes, giving renters a range of floor plans at accessible price points compared to surrounding cities like North Richland Hills or Fort Worth proper. Studios through spacious three-bedroom units are available across the city. Haltom City sits within the Birdville Independent School District, one of its top employers and a cornerstone of the community. With AT&T Stadium, Six Flags Over Texas, and NRH2O Family Water Park all within a short drive, there's no shortage of ways to fill a day off.
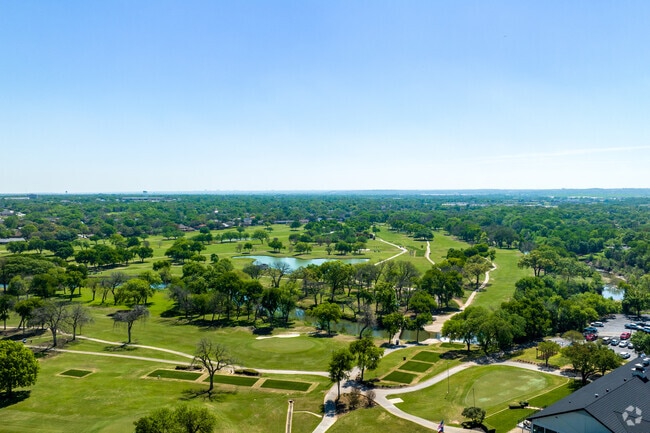
Diamond Oaks Country Club Golf Course is the place to unwind and play golf in Haltom City.
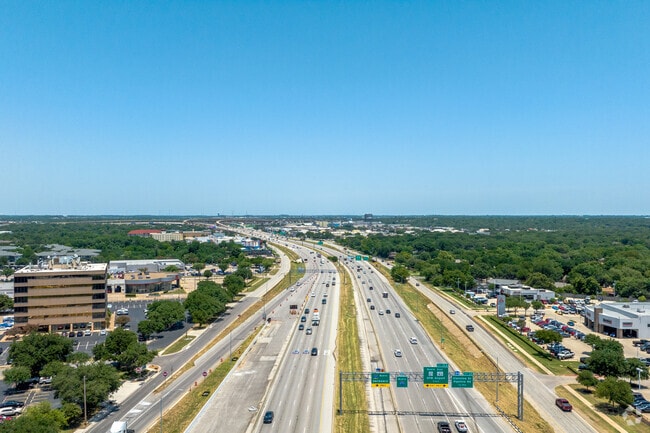
I-820 and the Airport Freeway in Haltom City give residents quick travel to the surrounding DFW.
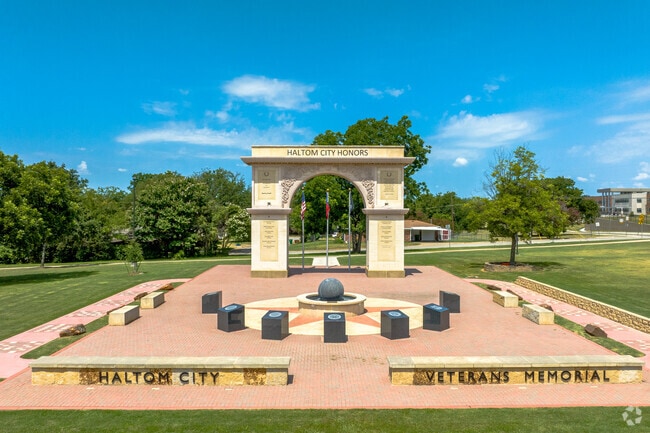
The Veteran Memorial stands proud in Haltom Road Park.
The Haltom Theatre was opened on December 27, 1941 in Haltom City.
Locals of Haltom City can shop for plants and fresh produce at Fort Worth’s Farmer’s Market.
The TEXrail runs through Mercantile Center Station in Haltom City.
Median Household Income
$55,434
Average: $69,666
Education
6,573
Residents Have a Degree
Job Market
23,934
Workers Employed
Median Age
35 Years
Largest Age Group
25-34 Years
Approximately 16% of Residents
Under 20
27%
Over 65
13%
Housing Distribution
Haltom City has more homeowners than renters.

Education Distribution
Review this city's overall education levels.

As of July 2026, the average apartment rent in Haltom City, TX is $930 for a studio, $1,164 for one bedroom, $1,507 for two bedrooms, and $1,882 for three bedrooms. Apartment rent in Haltom City has decreased by -4.8% in the past year.
Explore how walkable, bikeable, drivable, and transit-friendly Haltom City, TX is for everyday living.
Fairly Walkable
Walkability
Limited Public Transit
Transit
Exceptionally Drivable
Drivability
Fairly Bikeable
Bikeability
Public
Grades PK-5
489 Students

John D Spicer Elementary School
Public
Grades PK-5
386 Students

W T Francisco Elementary School
Public
Grades PK-5
351 Students
Public
Grades PK-5
674 Students

David E Smith Elementary School
Public
Grades PK-5
364 Students

IDEA Achieve College Preparatory
Public
Grades 6-8
399 Students
Public
Grades 6-8
507 Students
Public
Grades 6-8
507 Students
Public
Grades 6-8
954 Students

Public
Grades 6-8
954 Students
Public
Grades 9-12
2,785 Students
Public
Grades 9-12
138 Students

† Our analysis of utilities, groceries, transportation, healthcare, home prices, and other goods and services is sourced from the Cost of Living Index, a respected benchmark published by the Council for Community and Economic Research (C2ER) that provides a thorough overview of living expenses across different regions.
Rent data is provided by CoStar Group’s Market Trend reports. As the industry leader in commercial real estate information, analytics, and news, CoStar conducts extensive research to produce and maintain a comprehensive database of commercial real estate information. We combine this data with public record to provide the most up-to-date rental information available.
Consumer goods, services, and home prices are sourced from the Cost of Living Index published by the Council for Community and Economic Research (C2ER). The data on this page is updated quarterly. It was last published in June 2026.
Demographic information comes from Neustar and combines detailed address data with U.S. Census and American Community Survey statistics to produce reliable local estimates.


