Median Age
40 Years
Largest Age Group
30-39 Years
Approximately 13% of Residents
Under 20
24%
Over 65
19%
Avg Rent
$1,355
Population
51,491
Renter Mix
40% Rent
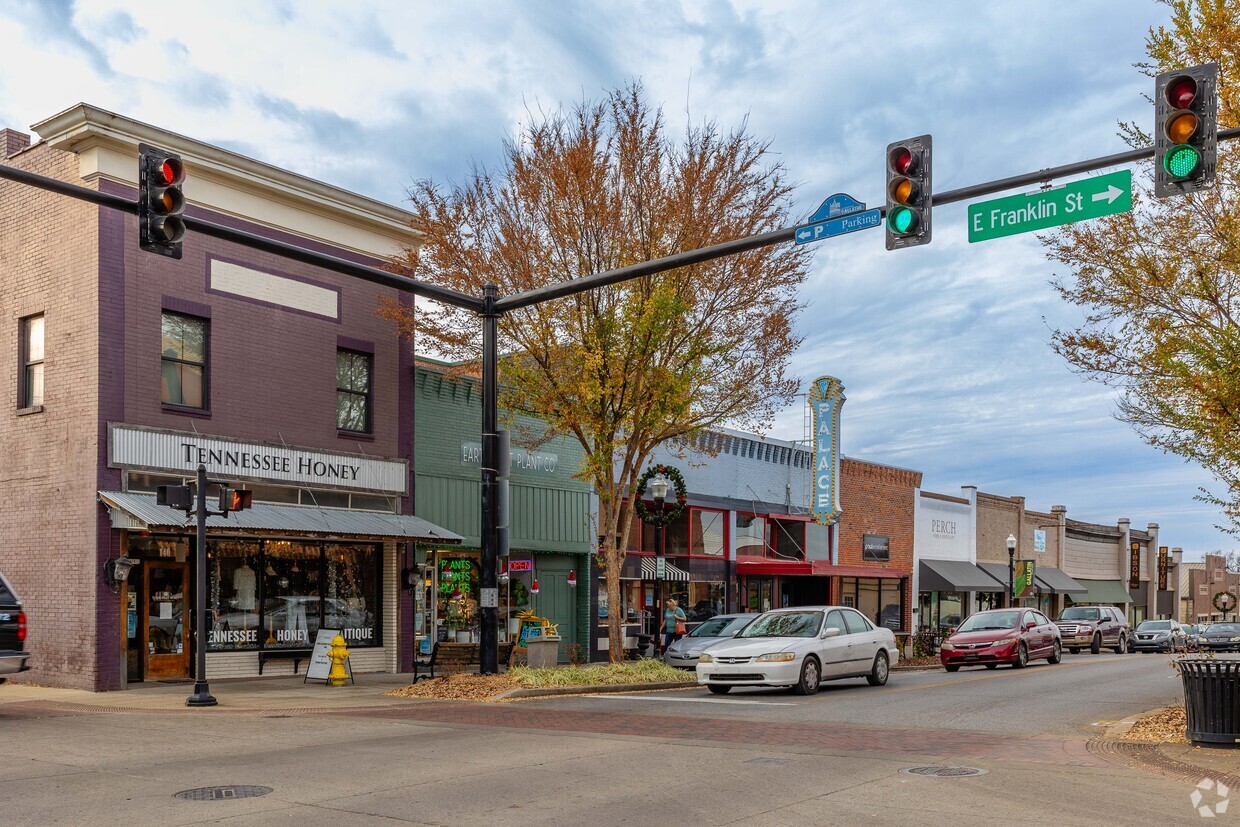
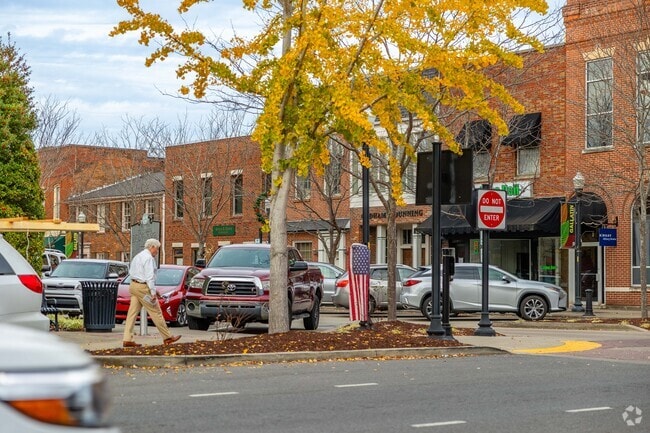
Nestled along the Cumberland River, the city of Gallatin sits just 30 miles northeast of Nashville. Although residents appreciate the suburb’s secluded, laid-back atmosphere along the river, they enjoy proximity to major metro areas for both work and play. Gallatin is home to an array of small businesses like restaurants and specialty shops. There’s a sense of historic charm that awaits in this city, with several historic landmarks to put on your must-see list, including Sumner County Museum and Rose Mont. Supermarkets, department stores, movie theaters, golf courses, and public parks are just a few of the amenities available in Gallatin. Many locals enjoy spending their spare time by the river swimming boating, and fishing.
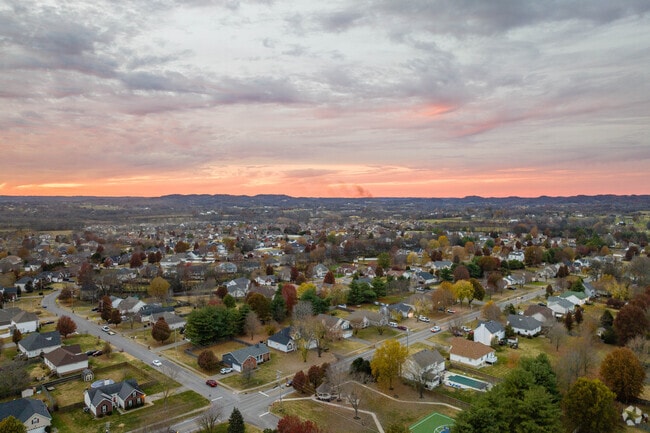
Gallatin is a sprawling suburban city in Middle Tennessee.
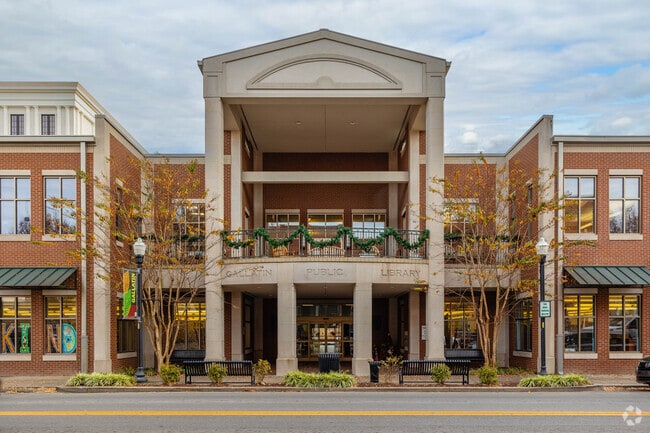
Gallatin's Public Library serves all of Gallatin and is located off the town square.
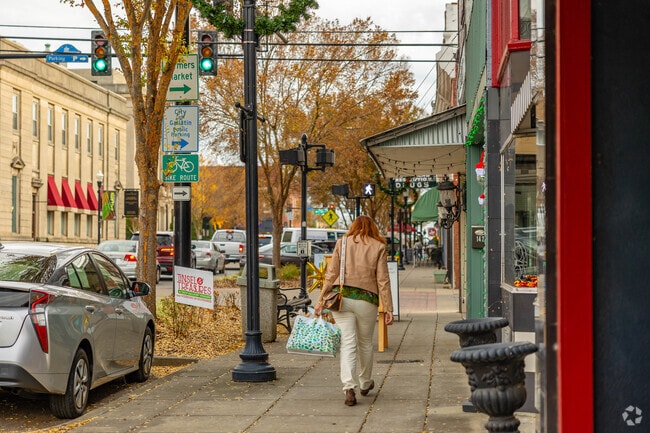
Locals in Gallatin can walk the town square and enjoy the quietness of the historical city.
Memorial Park has tons of fields for sports.
A major amenity of Gallatin is access to the Gallatin Marina for boating and water activities.
Lock 4 Mountain Bike Park is located in Sumner County.
Median Household Income
$61,920
Average: $82,941
Education
13,300
Residents Have a Degree
Job Market
25,779
Workers Employed
Median Age
40 Years
Largest Age Group
30-39 Years
Approximately 13% of Residents
Under 20
24%
Over 65
19%
Housing Distribution
Gallatin has more homeowners than renters.

Education Distribution
Review this city's overall education levels.

As of July 2026, the average apartment rent in Gallatin, TN is $976 for a studio, $1,361 for one bedroom, $1,600 for two bedrooms, and $1,928 for three bedrooms. Apartment rent in Gallatin has decreased by -0.3% in the past year.
The cost of living in Gallatin, TN is 6.8% lower than the national average. Generally, housing in Gallatin is 14.1% less expensive than the national average, with rent falling between $976 - $1,928. You can expect to pay 0.2% less for groceries, 11.0% less for utilities, and 12.9% less for transportation.
Compare Cities
Explore how walkable, bikeable, drivable, and transit-friendly Gallatin, TN is for everyday living.
Fairly Walkable
Walkability
Exceptionally Drivable
Drivability
Somewhat Bikeable
Bikeability
Public
Grades K-5
647 Students

Public
Grades PK-5
576 Students
Station Camp Elementary School
Public
Grades PK-5
872 Students

Public
Grades PK-5
872 Students
Public
Grades PK-5
591 Students
Public
Grades 6-8
904 Students
Public
Grades 6-8
652 Students

Public
Grades 6-8
661 Students

Public
Grades 6-8
585 Students
Public
Grades 6-8
666 Students

Sumner County Middle College High School
Public
Grades 9-12
69 Students

Public
Grades 9-12
1,137 Students
Public
Grades 9-12
993 Students
Public
Grades 9-12
1,644 Students
E B Wilson Virtual High School
Public
Grades 9-12
126 Students
† Our analysis of utilities, groceries, transportation, healthcare, home prices, and other goods and services is sourced from the Cost of Living Index, a respected benchmark published by the Council for Community and Economic Research (C2ER) that provides a thorough overview of living expenses across different regions.
Rent data is provided by CoStar Group’s Market Trend reports. As the industry leader in commercial real estate information, analytics, and news, CoStar conducts extensive research to produce and maintain a comprehensive database of commercial real estate information. We combine this data with public record to provide the most up-to-date rental information available.
Consumer goods, services, and home prices are sourced from the Cost of Living Index published by the Council for Community and Economic Research (C2ER). The data on this page is updated quarterly. It was last published in June 2026.
Demographic information comes from Neustar and combines detailed address data with U.S. Census and American Community Survey statistics to produce reliable local estimates.


