Median Age
39 Years
Largest Age Group
45-54 Years
Approximately 18% of Residents
Under 20
28%
Over 65
10%
Avg Rent
$1,482
Population
251,551
Renter Mix
35% Rent
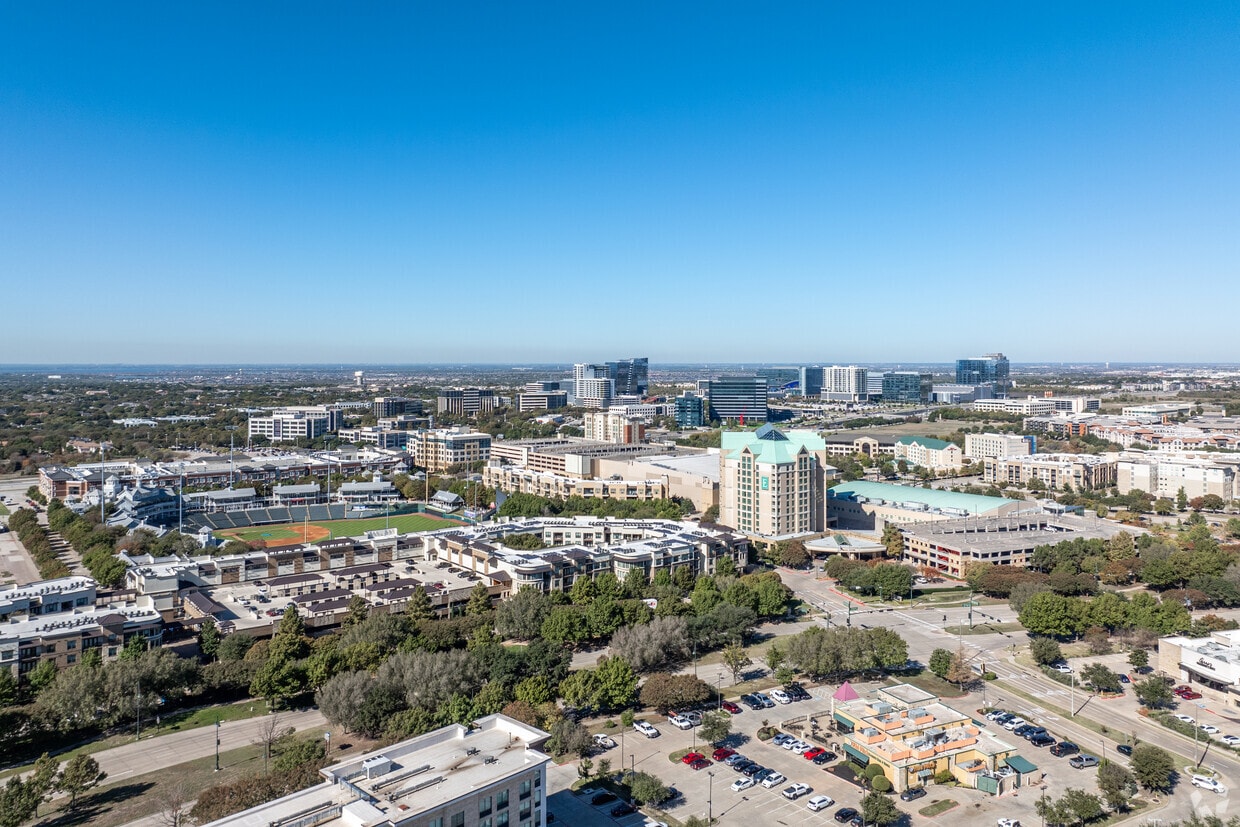
Frisco is one of the fastest-growing communities in America, and has been for some time. Historically serving as a home base for Dallas-area commuters, Frisco has developed a local culture that elevates it beyond a mere bedroom town.
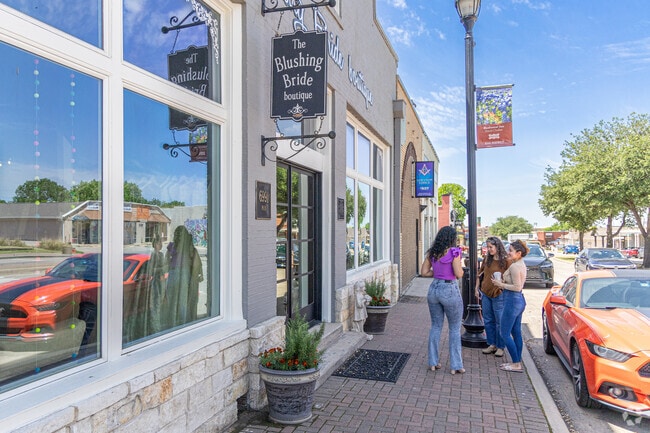
The public education system is excellent, with dozens of top-performing schools all across the city. Apartment and home rentals range from the swanky to the sensible, giving everyone numerous options regardless of budget. Upscale shopping and dining districts such as Stonebriar Centre are popular among locals and visitors alike, and the Frisco Square area’s mix of office, retail, and residential space has become a highly desirable location for folks who want an alternative to the daily commute in and out of Dallas.
Local venues such as the Dr. Pepper Ballpark and Toyota Stadium host everything from sporting events to concerts, giving locals a variety of entertainment options throughout the year.
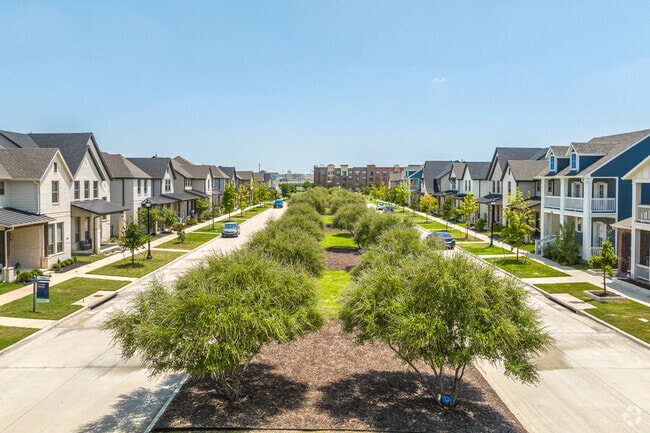
Luxury homes in West Frisco embody the epitome of upscale living.
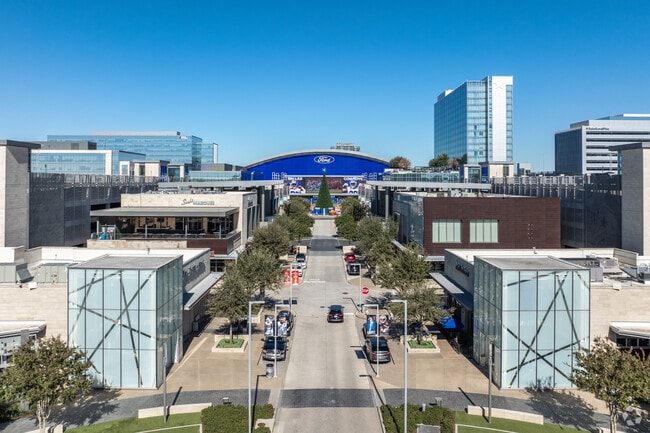
Frisco has stadiums in major districts, like Ford Center.
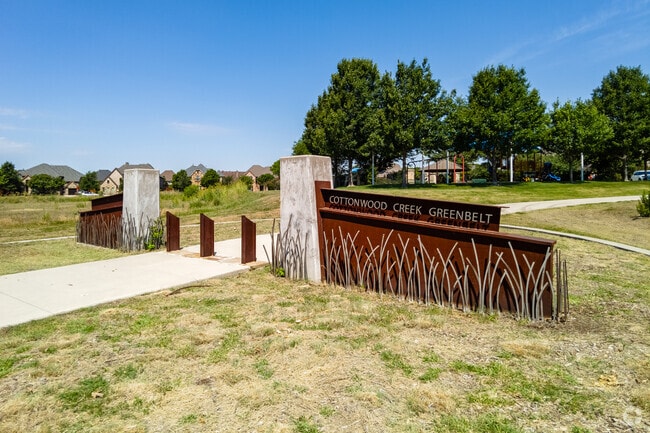
Cottonwood Creek Greenbelt is a popular spot for locals to walk and relax.
Riders Field is a baseball park located in Stonebriar in Frisco, Texas.
There are many suburbs in Frisco, like Stonebriar, that allow residents to find a fitting home.
The Jack Hamilton Park sign welcomes families to the park daily.
Median Household Income
$133,444
Average: $160,232
Education
118,840
Residents Have a Degree
Job Market
138,791
Workers Employed
Median Age
39 Years
Largest Age Group
45-54 Years
Approximately 18% of Residents
Under 20
28%
Over 65
10%
Housing Distribution
Frisco has more homeowners than renters.

Education Distribution
Review this city's overall education levels.

As of July 2026, the average apartment rent in Frisco, TX is $1,308 for a studio, $1,479 for one bedroom, $2,085 for two bedrooms, and $2,744 for three bedrooms. Apartment rent in Frisco has decreased by -0.1% in the past year.
Explore how walkable, bikeable, drivable, and transit-friendly Frisco, TX is for everyday living.
Moderately Walkable
Walkability
Moderately Drivable
Drivability
Fairly Bikeable
Bikeability
Jim Spradley Elementary School
Public
Grades K-5
799 Students

Public
Grades PK-5
770 Students
Public
Grades K-5
728 Students
Public
Grades K-5
725 Students
Public
Grades PK-5
694 Students
Public
Grades 6-8
1,094 Students
Public
Grades 6-8
1,076 Students
Pioneer Heritage Middle School
Public
Grades 6-8
1,037 Students
Public
Grades 6-8
1,032 Students
Public
Grades 6-8
1,026 Students
Public
Grades 9-12
2,229 Students
Public
Grades 9-12
2,082 Students

Public
Grades 9-12
1,665 Students
Founders Classical Academy - Frisco
Public
Grades K-12
1,013 Students
Public
Grades 9-12
2,275 Students

† Our analysis of utilities, groceries, transportation, healthcare, home prices, and other goods and services is sourced from the Cost of Living Index, a respected benchmark published by the Council for Community and Economic Research (C2ER) that provides a thorough overview of living expenses across different regions.
Rent data is provided by CoStar Group’s Market Trend reports. As the industry leader in commercial real estate information, analytics, and news, CoStar conducts extensive research to produce and maintain a comprehensive database of commercial real estate information. We combine this data with public record to provide the most up-to-date rental information available.
Consumer goods, services, and home prices are sourced from the Cost of Living Index published by the Council for Community and Economic Research (C2ER). The data on this page is updated quarterly. It was last published in June 2026.
Demographic information comes from Neustar and combines detailed address data with U.S. Census and American Community Survey statistics to produce reliable local estimates.


