
Vintage Franklin Apartments
871 Oak Meadow Dr,
Franklin, TN 37064
$1,538 - $5,316
1-3 Beds
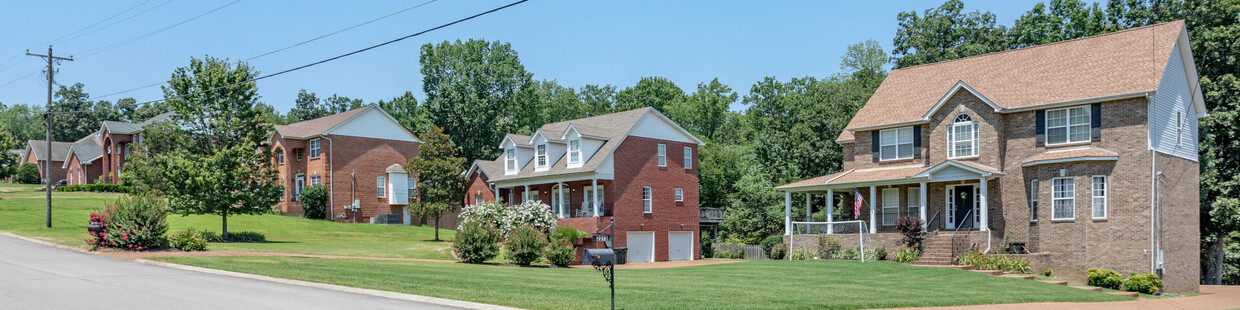

Franklin, Tennessee combines historic preservation with contemporary living, offering an appealing suburban setting just 21 miles south of Nashville. This city of over 83,000 residents features a picturesque downtown district and diverse rental options throughout its neighborhoods. Current average rents range from $1,746 for one-bedroom units to $3,071 for three-bedroom homes. While rental prices have remained relatively stable year-over-year, Franklin continues to draw residents with its tree-lined streets and established neighborhoods.
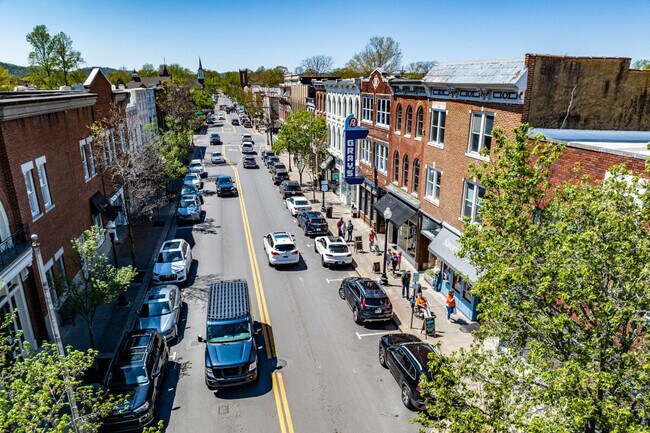
The heart of Franklin revolves around its historic downtown square, where locally-owned shops and eateries line the streets alongside the restored Franklin Theatre. Outdoor enthusiasts appreciate The Park at Harlinsdale Farm, a 200-acre former Tennessee Walking Horse farm, and Eastern Flank Battlefield Park, which preserves an important Civil War site. Notable areas include Cool Springs, with its extensive retail district; Westhaven, recognized for its architectural details; and Downtown Franklin, where historic properties blend with newer developments. Major employers in the area include Nissan North America's headquarters and Community Health Systems. The community calendar stays full with signature events like the Pilgrimage Music & Cultural Festival and the winter tradition of Dickens of a Christmas.
An aerial view of Franklin's historic downtown area.
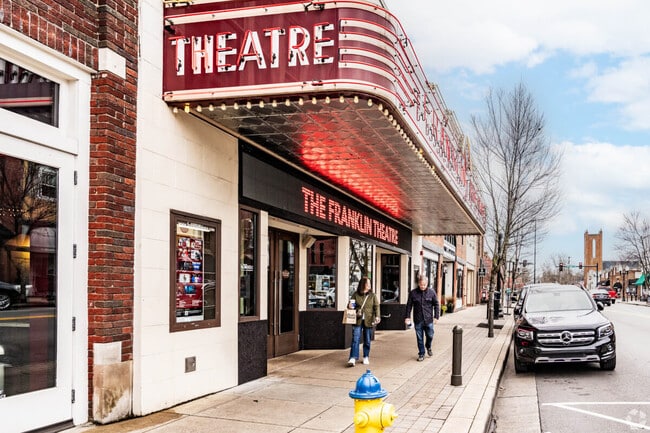
A couple walks past the Historic Franklin Theater.
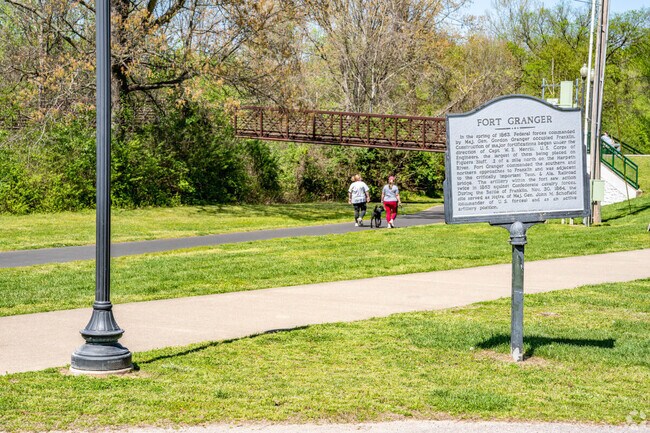
Two people walk a dog through Fort Granger Park.
As of March 2026, the average apartment rent in Franklin, TN is $1,714 for a studio, $1,746 for one bedroom, $2,148 for two bedrooms, and $3,044 for three bedrooms. Apartment rent in Franklin has decreased by -0.5% in the past year.
The cost of living in Franklin, TN is 1.6% lower than the national average. Generally, housing in Franklin is 2.1% more expensive than the national average, with rent falling between $1,714 - $3,044. You can expect to pay 0.1% more for groceries, 3.2% less for utilities, and 9.8% less for transportation.
Explore how walkable, bikeable, drivable, and transit-friendly Franklin, TN is for everyday living.
Car-Dependent
This area is considered a car-dependent area and most errands will require a car.
Minimal Transit
You'll likely want a car when living in this area since it has few transit options.
Somewhat Bikeable
You might be able to find places to ride your bike in this area, but you’ll most likely want your car for most errands.
Public
Grades PK-5

Public
Grades PK-5
Public
Grades PK-5
Public
Grades K-5
Public
Grades PK-5
Public
Grades 6-8

Public
Grades 6-8

Public
Grades 6-8
Hillsboro Elementary/ Middle School
Public
Grades PK-8
Public
Grades K-8

Public
Grades 9-12

Public
Grades 9-12
Public
Grades 9-12
Public
Grades 9-12
Public
Grades 9-12

715
Communities
198,674
Units
340
Cities

83
Communities
16,409
Units
24
Cities

3,487
Communities
959,069
Units
894
Cities

43
Communities
16,259
Units
30
Cities

624
Communities
174,107
Units
247
Cities

133
Communities
21,884
Units
71
Cities
† Our analysis of utilities, groceries, transportation, healthcare, home prices, and other goods and services is sourced from the Cost of Living Index, a respected benchmark published by the Council for Community and Economic Research (C2ER) that provides a thorough overview of living expenses across different regions.
Rent data is provided by CoStar Group’s Market Trend reports. As the industry leader in commercial real estate information, analytics, and news, CoStar conducts extensive research to produce and maintain a comprehensive database of commercial real estate information. We combine this data with public record to provide the most up-to-date rental information available.
Consumer goods, services, and home prices are sourced from the Cost of Living Index published by the Council for Community and Economic Research (C2ER). The data on this page is updated quarterly. It was last published in February 2026.


