Median Age
43 Years
Largest Age Group
55-64 Years
Approximately 14% of Residents
Under 20
21%
Over 65
21%
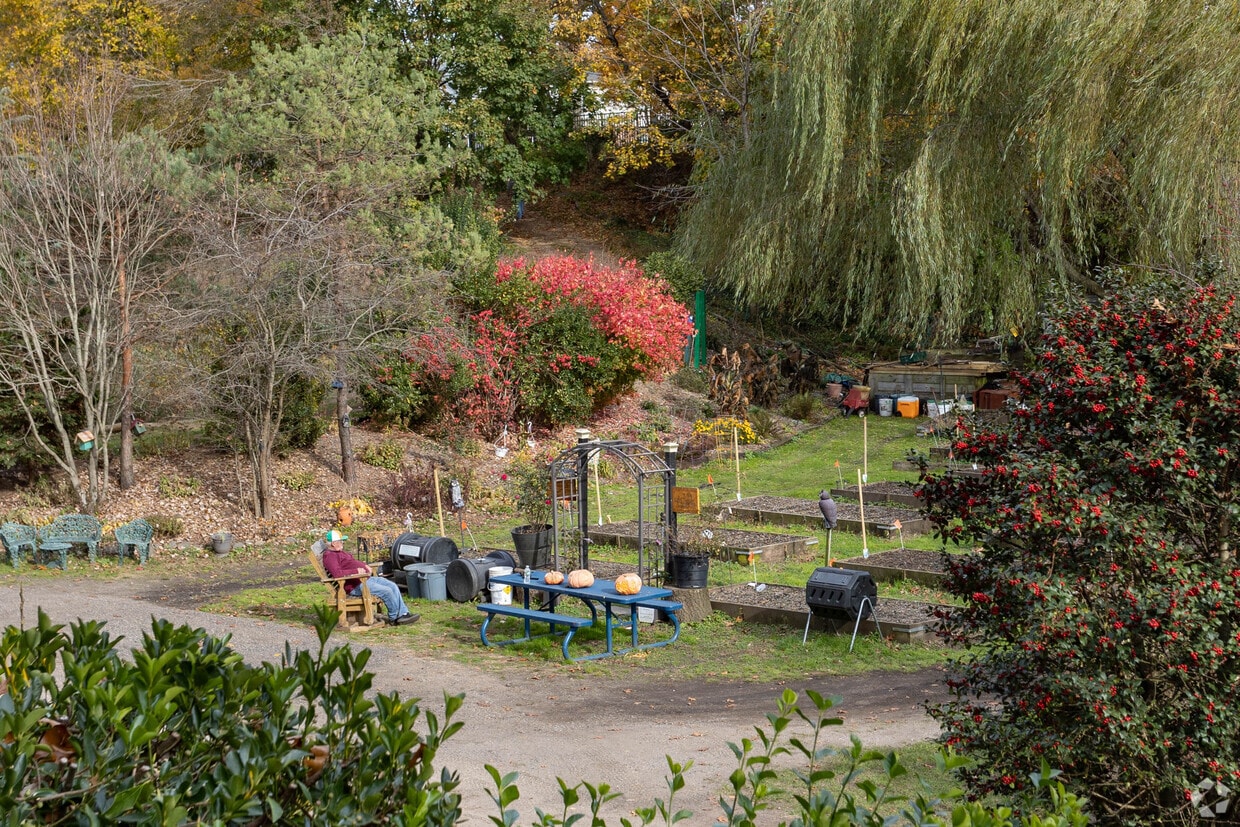
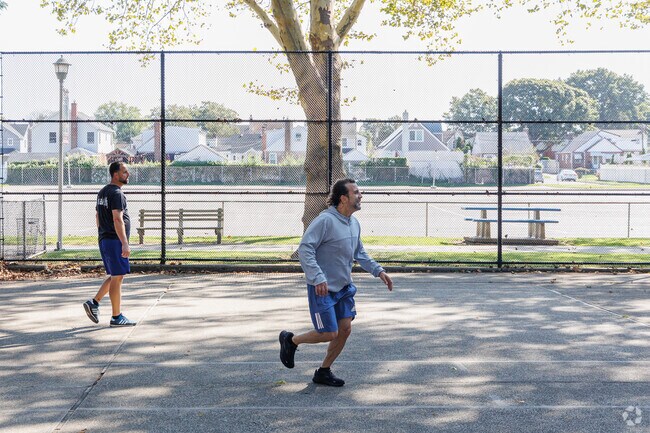
Nestled between Southern State Parkway and Garden City Country Club, Franklin Square is a bustling urban town just outside of Queens. Franklin Square is home to cafes, restaurants, bars, movie theaters, supermarkets, and more. The Franklin Square Public Library and the Town of Hempstead Rath Park are popular places for families in the area. This sprawling park offers ball fields, an outdoor swimming pool, walking paths, and playgrounds.
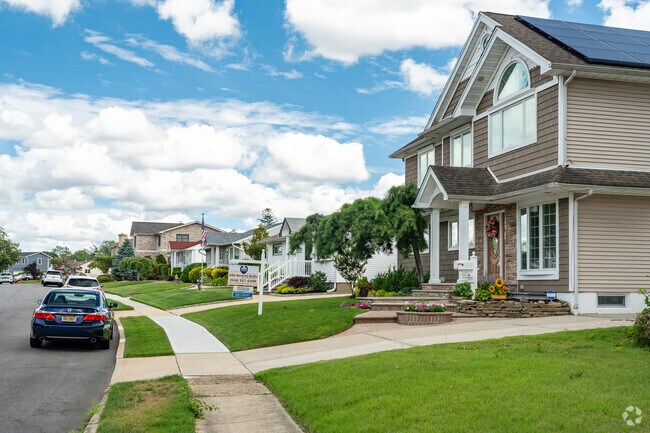
Franklin Square is home to excellent public schools like Washington Street School, a major perk for families in the area. Various apartments and single-family homes are available in this mainly residential town. Franklin Square is the ideal area for commuters with its unbeatable proximity to the heart of Queens and the John F. Kennedy International Airport.
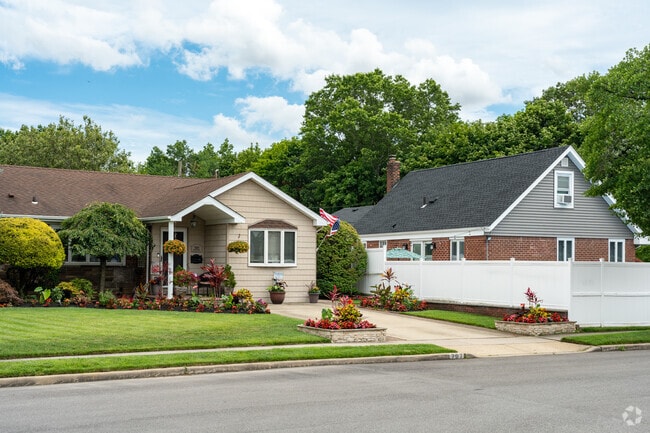
Row of homes lined by sidewalks and freshly cut grass.
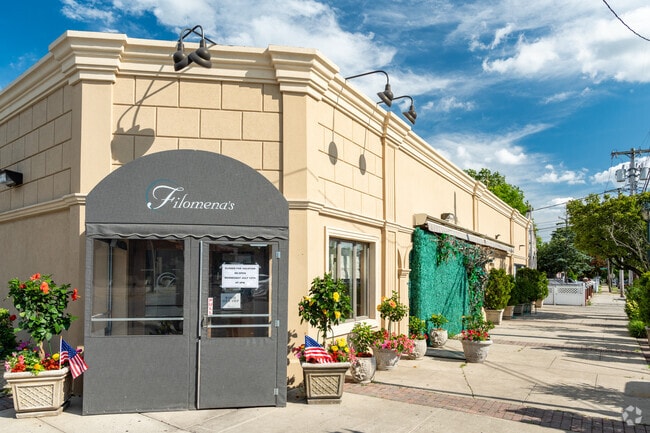
Filomena's is a chic Italian restaurant in Franklin Square.
Where playful spirits and amateur athletes unite for a day of action-packed fun.
Residents of Franklin Square often go to Centennial Gardens in nearby Floral Park.
The closest LIRR station to Franklin Square is only a mile away in Stewart Manor.
The cakes, cookies and muffins are amazing at The Sweet Life Bake Shop in Franklin Square.
Median Household Income
$122,842
Average: $146,618
Education
8,768
Residents Have a Degree
Job Market
15,143
Workers Employed
Median Age
43 Years
Largest Age Group
55-64 Years
Approximately 14% of Residents
Under 20
21%
Over 65
21%
Housing Distribution
Franklin Square has more homeowners than renters.

Education Distribution
Review this city's overall education levels.

Explore how walkable, bikeable, drivable, and transit-friendly Franklin Square, NY is for everyday living.
Moderately Walkable
Walkability
Some Public Transit
Transit
Fairly Drivable
Drivability
Fairly Bikeable
Bikeability
Public
Grades PK-5
483 Students

Public
Grades PK-5
594 Students

Public
Grades PK-5
782 Students

Public
Grades K-5
410 Students
Public
Grades 6-12
1,644 Students
Valley Stream North High School
Public
Grades 6-12
1,260 Students
Public
Grades 6-12
1,644 Students
Valley Stream North High School
Public
Grades 6-12
1,260 Students
† Our analysis of utilities, groceries, transportation, healthcare, home prices, and other goods and services is sourced from the Cost of Living Index, a respected benchmark published by the Council for Community and Economic Research (C2ER) that provides a thorough overview of living expenses across different regions.
Rent data is provided by CoStar Group’s Market Trend reports. As the industry leader in commercial real estate information, analytics, and news, CoStar conducts extensive research to produce and maintain a comprehensive database of commercial real estate information. We combine this data with public record to provide the most up-to-date rental information available.
Consumer goods, services, and home prices are sourced from the Cost of Living Index published by the Council for Community and Economic Research (C2ER). The data on this page is updated quarterly. It was last published in June 2026.
Demographic information comes from Neustar and combines detailed address data with U.S. Census and American Community Survey statistics to produce reliable local estimates.


