
Atwell at Folsom Ranch
14481 Southpointe Dr,
Folsom, CA 95630
$2,055 - $3,220 Total Monthly Price
1-3 Beds
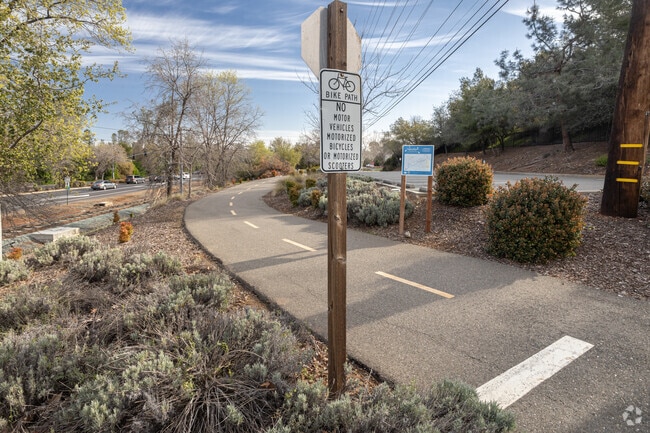
Located in the Sierra Nevada foothills, Folsom combines outdoor recreation with city conveniences. The city features an extensive network of bike trails, including the American River Bike Trail connecting to Sacramento. Folsom Lake and Lake Natoma offer water sports and shoreline activities throughout the year. The historic district along Sutter Street preserves Gold Rush-era architecture, housing local businesses in its well-maintained buildings. Current rental options include both contemporary communities and properties in historic neighborhoods, with average monthly rents at $2,009 for one-bedroom units and $2,403 for two bedrooms.
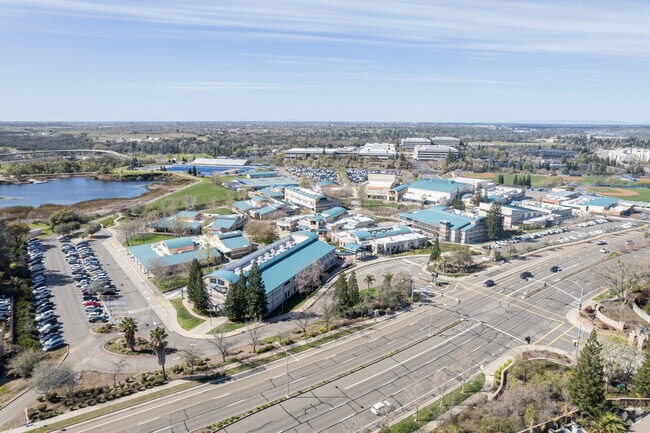
Folsom's history as a Gold Rush settlement has transformed over time, with Intel Corporation now established as a major employer in the region. The Folsom Cordova Unified School District serves the area, while Folsom Lake College provides higher education opportunities. New development continues in the Folsom Plan Area south of Highway 50, which will expand residential options by 11,000 homes. Residents enjoy Livermore Community Park and the Johnny Cash Trail, which commemorates the musician's famous 1968 performance at Folsom State Prison. The city offers a California lifestyle that embraces both its historical roots and contemporary development.
Residents of Folsom have access to quality public education, such as Folsom High School.
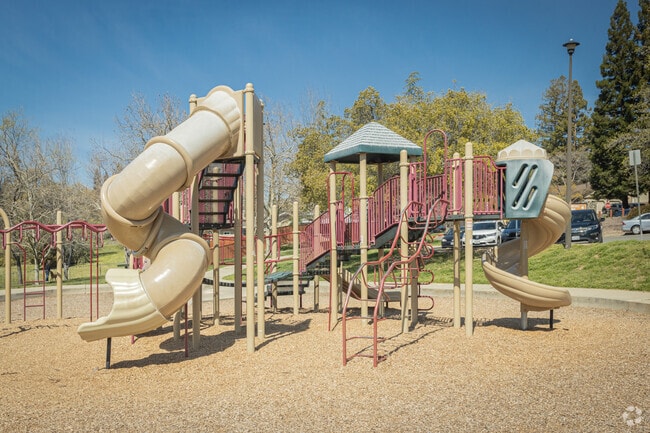
Ed Mitchell Park in Folsom has a large playground with two slides.
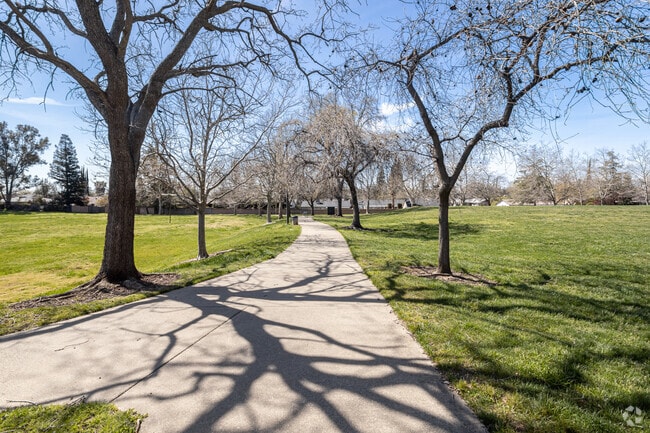
There are ample walking paths in Ed Mitchell Park of Folsom, CA.
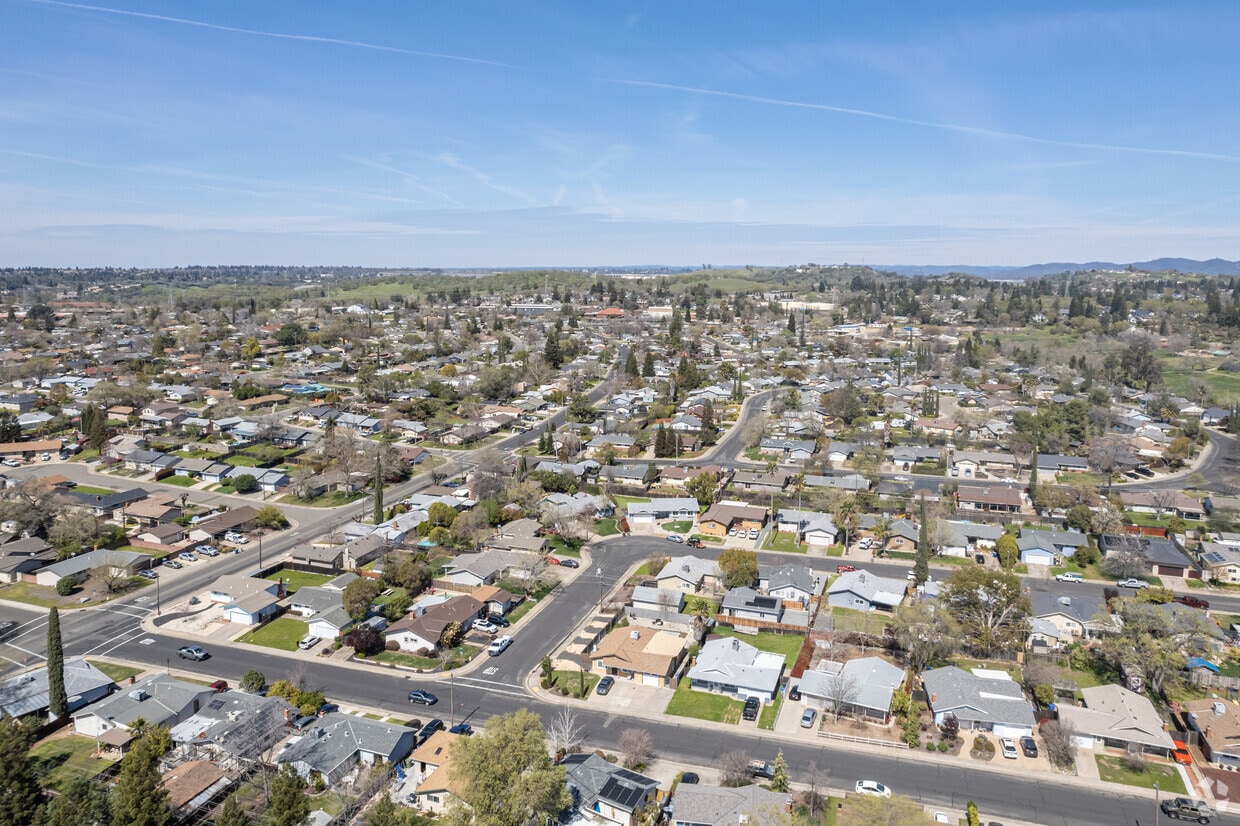
Folsom has traditional single-family homes.
Little Free Libraries are scattered all over Folsom, CA.
Being a relatively new park in Folsom, Econome Park is quickly gaining popularity.
As of March 2026, the average apartment rent in Folsom, CA is $1,682 for a studio, $2,054 for one bedroom, $2,431 for two bedrooms, and $2,836 for three bedrooms. Apartment rent in Folsom has increased by 2.2% in the past year.
Explore how walkable, bikeable, drivable, and transit-friendly Folsom, CA is for everyday living.
Somewhat Walkable
You might be able to get out and walk when living in this area. Some errands can be accomplished on foot, but for others you’ll need a car.
Minimal Transit
You'll likely want a car when living in this area since it has few transit options.
Bikeable
While there’s some bike infrastructure in this area, you’ll still need a car for many errands.
Public
Grades K-5

Public
Grades K-5
Public
Grades K-5
Public
Grades K-5
Public
Grades K-5

Public
Grades 6-8
Public
Grades 6-8

Public
Grades 9-12

Public
Grades 9-12
Public
Grades 9-12


3,490
Communities
959,772
Units
895
Cities

99
Communities
26,568
Units
75
Cities

65
Communities
10,469
Units
32
Cities

30
Communities
5,932
Units
18
Cities

19
Communities
2,939
Units
15
Cities

16
Communities
2,400
Units
13
Cities
† Our analysis of utilities, groceries, transportation, healthcare, home prices, and other goods and services is sourced from the Cost of Living Index, a respected benchmark published by the Council for Community and Economic Research (C2ER) that provides a thorough overview of living expenses across different regions.
Rent data is provided by CoStar Group’s Market Trend reports. As the industry leader in commercial real estate information, analytics, and news, CoStar conducts extensive research to produce and maintain a comprehensive database of commercial real estate information. We combine this data with public record to provide the most up-to-date rental information available.
Consumer goods, services, and home prices are sourced from the Cost of Living Index published by the Council for Community and Economic Research (C2ER). The data on this page is updated quarterly. It was last published in February 2026.


