
10 Hanover Square
10 Hanover Sq,
New York, NY 10005
$3,817 - $8,220
Studio - 3 Beds


Area Guide
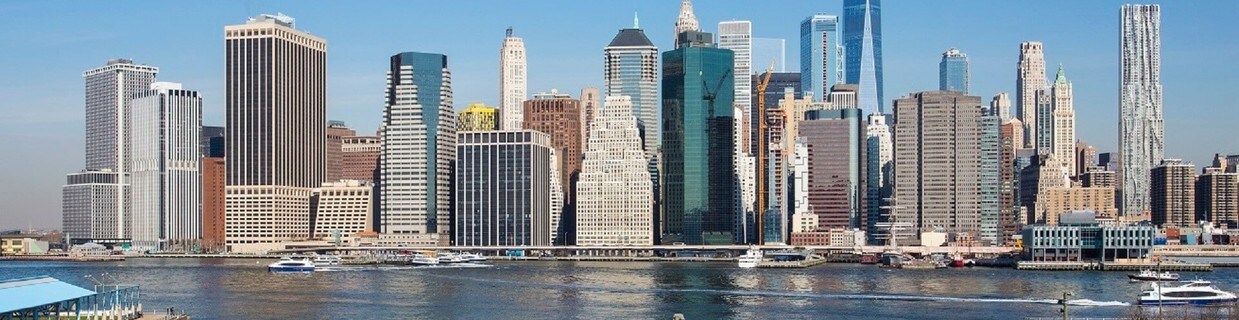
The Financial District sits at the tip of Lower Manhattan. It is the oldest part of New York City – the city was created here in 1624. Known as the world’s center of finance, the district is home to the largest stock exchange in the world, the New York Stock Exchange. Sometimes referred to as FiDi, the district contains a variety of high-end restaurants and bars along Wall Street, popular hangouts for those working at the exchange.
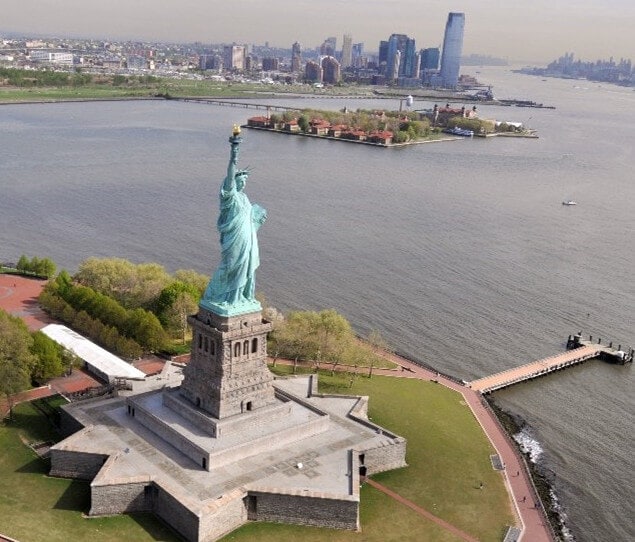
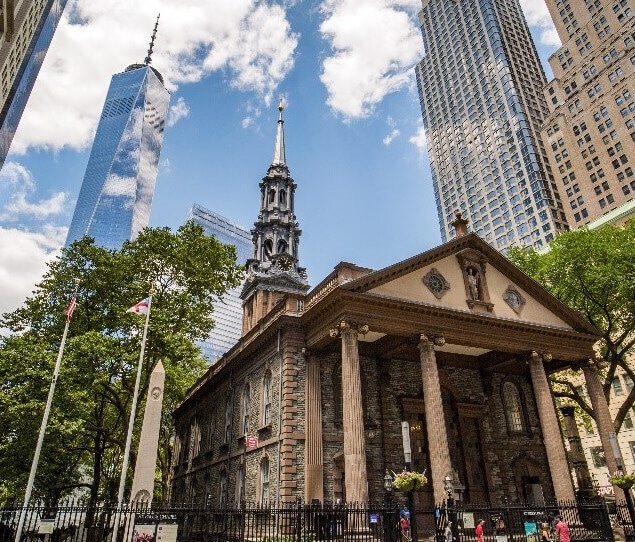
Many landmarks are in the Financial District, including One World Trade Center, The National 9/11 Memorial and Museum, the Ellis Island National Immigration Museum, the Castle Clinton National Monument, and Battery Park. National Historic Sites include St. Paul’s Chapel, founded in 1766 and visited by George Washington after his inauguration in 1789. Stone Street, one of New York’s oldest streets, is a historic district, first paved in 1658.
Because so much is happening in the Financial District, it is packed with residents, workers, and tourists. It is considered one of Manhattan’s most expensive neighborhoods, but that hasn’t hampered its appeal – the district’s population has doubled in the last 20 years, and it is home to roughly 61,000 people. Today, what was once considered a daytime destination for workers around the city is one of Manhattan’s most-loved neighborhoods.
Up-close architecture
An aerial view of The Statue of Liberty
St. Paul’s Chapel among skyscrapers and one World Trade Center
Statue of Liberty facing the World Trade Center
The tip of the Financial District and Battery Park
World Trade Center lights at night
As of July 2026, the average apartment rent in Financial District is $4,012 for a studio, $5,233 for one bedroom, $7,546 for two bedrooms, and $10,646 for three bedrooms. Apartment rent in Financial District has increased by 4.3% in the past year.
Studio
472 sq ft
Average Sq Ft
$4,012/month
Average Rent
1 BR
594 sq ft
Average Sq Ft
$5,233/month
Average Rent
2 BR
821 sq ft
Average Sq Ft
$7,546/month
Average Rent
3 BR
585 sq ft
Average Sq Ft
$10,646/month
Average Rent
Explore how walkable, bikeable, drivable, and transit-friendly Financial District - New York, NY is for everyday living.
Exceptionally Walkable
Walkability
Exceptional Public Transit
Transit
Fairly Drivable
Drivability
Moderately Bikeable
Bikeability
In Financial District - New York, NY, daily errands are quick and hassle-free.
Supermarket Within a 5 Minute Walk
Groceries
Exceptional Restaurant Variety Nearby
Restaurants
Exceptional Café Variety Nearby
Cafes
Exceptional Variety of Shops Nearby
Shopping
Financial District - New York, NY provides ample green space and fitness centers within easy reach.
Exceptional Amount of Park Space Nearby
Parks
Exceptional Wellness Amenity Variety Nearby
Wellness
Get a sense of what it’s like to live in Financial District - New York, NY from everyday activity to noise and nightlife.
Exceptionally Vibrant Atmosphere
Vibrancy
Exceptional Nightlife Variety Nearby
Nightlife
Very Noisy
Quiet Score
† Our analysis of utilities, groceries, transportation, healthcare, home prices, and other goods and services is sourced from the Cost of Living Index, a respected benchmark published by the Council for Community and Economic Research (C2ER) that provides a thorough overview of living expenses across different regions.
Rent data is provided by CoStar Group’s Market Trend reports. As the industry leader in commercial real estate information, analytics, and news, CoStar conducts extensive research to produce and maintain a comprehensive database of commercial real estate information. We combine this data with public record to provide the most up-to-date rental information available.
Consumer goods, services, and home prices are sourced from the Cost of Living Index published by the Council for Community and Economic Research (C2ER). The data on this page is updated quarterly. It was last published in June 2026.
Demographic information comes from Neustar and combines detailed address data with U.S. Census and American Community Survey statistics to produce reliable local estimates.


