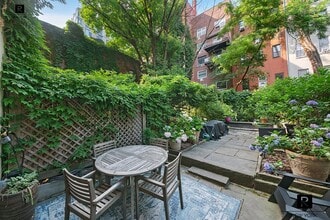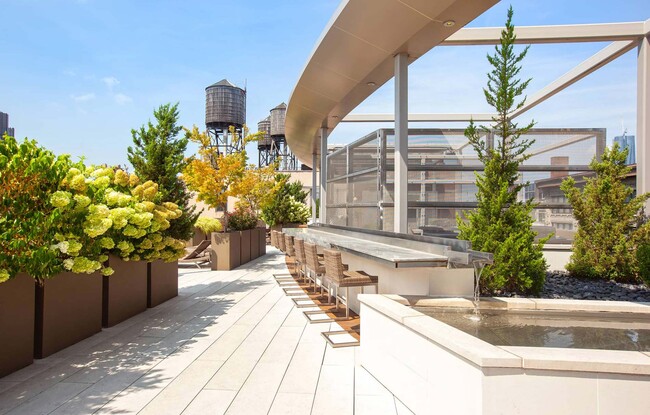
21 Chelsea
120 W 21st St,
New York, NY 10011
$5,394 - $9,470
Studio - 5 Beds
Area Guide
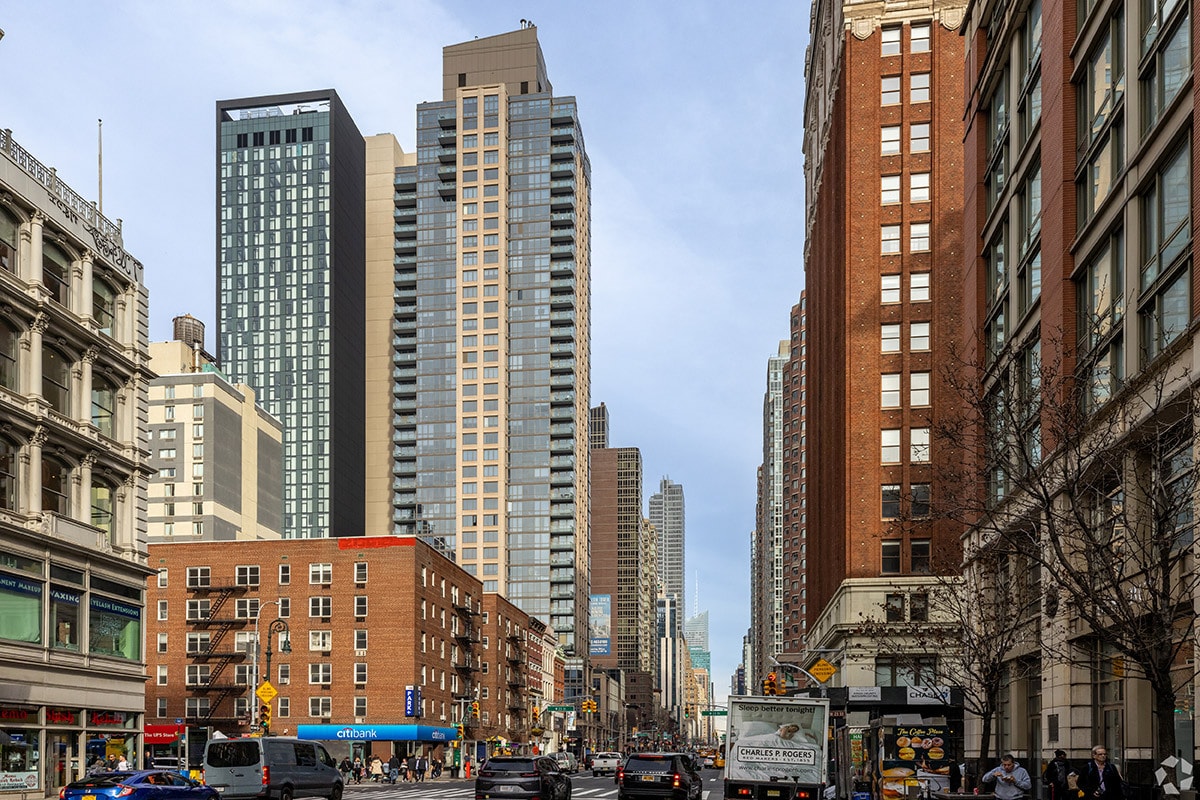
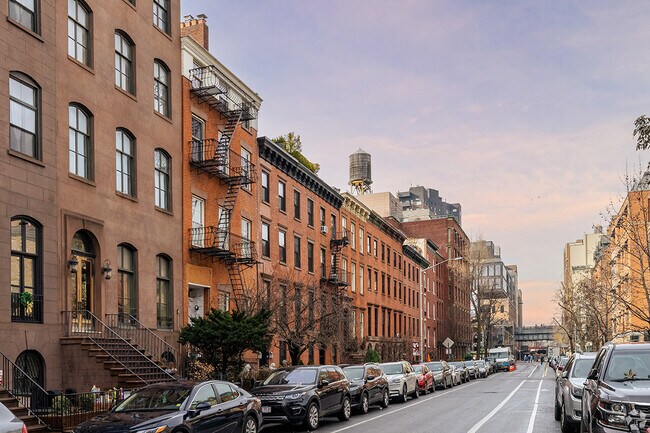
Welcome to Chelsea, the art district of Manhattan. Home to more than 200 art galleries, Chelsea is one of the city’s trendiest neighborhoods, complete with museums, waterfront views, and historic brownstones dating back to the early 1800s.
What’s it like to live in Chelsea? This neighborhood is loved by residents for its walkability and multitude of entertainment options. Chelsea is located along the Hudson River in Midtown Manhattan, with Lower Manhattan to the south and Hell’s Kitchen to the north. The neighborhood is home to the Fashion Institute of Technology, the Rubin Museum of Art, the Manhattan Mall, and Penn Station. It extends from 14th Street north to 34th Street, and from the river east to 6th Avenue.
Built in the 1890s, Chelsea Market is listed on the National Register of Historic Places and is one of the neighborhood’s most-loved destinations. This giant shopping and dining destination covers an entire city block and is home to boutiques, restaurants, and offices. Several broadcasting companies have offices and studios here, including Oxygen, Food Network, and even Google... Renters should know that such a desirable neighborhood comes with a slightly larger price tag than other locations. How much does it really cost to live in Chelsea? With an average monthly rent of $4,840, this neighborhood’s cost of living is almost 70% higher than the New York state average. However, for all that the area offers, the price may be worth it depending on what renters are looking for in a place to call home.
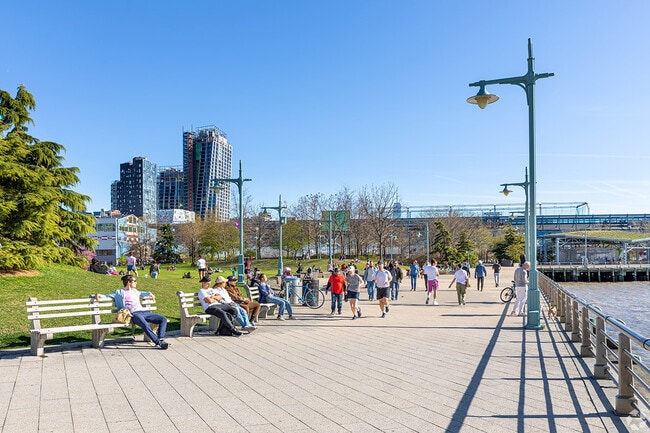
Chelsea Piers Parks offers abundant water views.
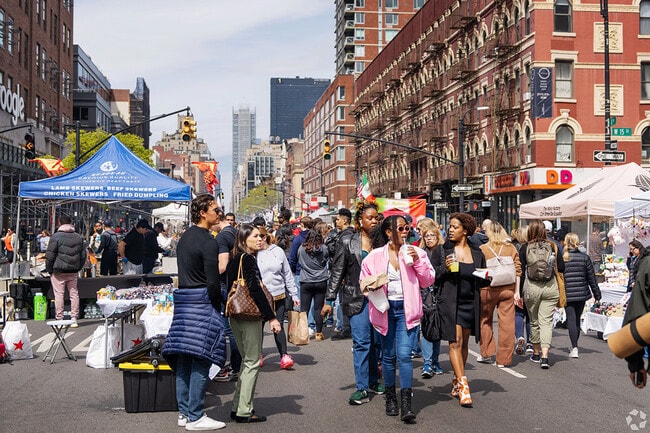
Residents stroll on closed streets during the Chelsea Spring Fair.
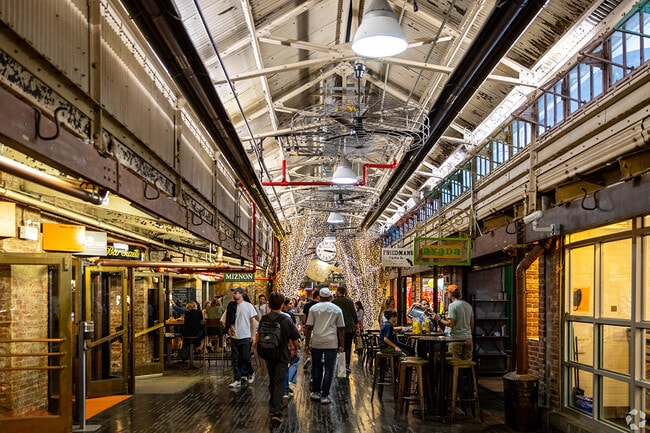
Chelsea Market is a former biscuit factory that houses a high-end food court and boutique shops.
As of August 2026, the average apartment rent in Chelsea is $3,987 for a studio, $5,393 for one bedroom, $7,746 for two bedrooms, and $13,069 for three bedrooms. Apartment rent in Chelsea has increased by 4.1% in the past year.
Studio
426 sq ft
Average Sq Ft
$3,987/month
Average Rent
1 BR
599 sq ft
Average Sq Ft
$5,393/month
Average Rent
2 BR
777 sq ft
Average Sq Ft
$7,746/month
Average Rent
3 BR
1,362 sq ft
Average Sq Ft
$13,069/month
Average Rent
Explore how walkable, bikeable, drivable, and transit-friendly Chelsea - New York, NY is for everyday living.
Exceptionally Walkable
Walkability
Exceptional Public Transit
Transit
Moderately Drivable
Drivability
Very Bikeable
Bikeability
In Chelsea - New York, NY, daily errands are quick and hassle-free.
Supermarket Within a 5 Minute Walk
Groceries
Exceptional Restaurant Variety Nearby
Restaurants
Exceptional Café Variety Nearby
Cafes
Exceptional Variety of Shops Nearby
Shopping
Chelsea - New York, NY provides ample green space and fitness centers within easy reach.
Exceptional Amount of Park Space Nearby
Parks
Exceptional Wellness Amenity Variety Nearby
Wellness
Get a sense of what it’s like to live in Chelsea - New York, NY from everyday activity to noise and nightlife.
Exceptionally Vibrant Atmosphere
Vibrancy
Exceptional Nightlife Variety Nearby
Nightlife
Very Noisy
Quiet Score

† Our analysis of utilities, groceries, transportation, healthcare, home prices, and other goods and services is sourced from the Cost of Living Index, a respected benchmark published by the Council for Community and Economic Research (C2ER) that provides a thorough overview of living expenses across different regions.
Rent data is provided by CoStar Group’s Market Trend reports. As the industry leader in commercial real estate information, analytics, and news, CoStar conducts extensive research to produce and maintain a comprehensive database of commercial real estate information. We combine this data with public record to provide the most up-to-date rental information available.
Consumer goods, services, and home prices are sourced from the Cost of Living Index published by the Council for Community and Economic Research (C2ER). The data on this page is updated quarterly. It was last published in June 2026.
Demographic information comes from Neustar and combines detailed address data with U.S. Census and American Community Survey statistics to produce reliable local estimates.