
Sacred Heart Lofts
160 Seabury St,
Fall River, MA 02720
$1,995 - $2,995 Plus Fees
2-3 Beds | 12 Month Lease
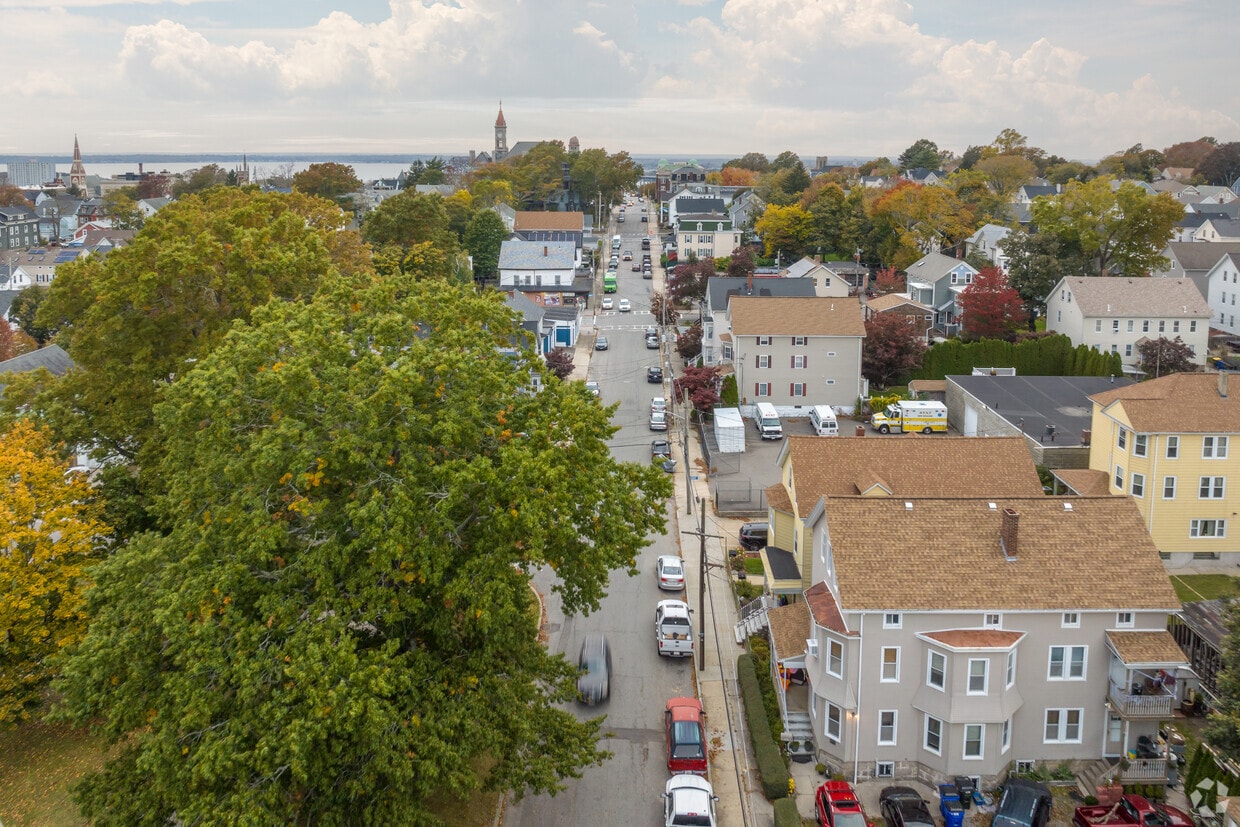
Fall River combines historical significance with waterfront living along Mount Hope Bay. This Massachusetts city, known for its textile manufacturing heritage, offers waterfront views and city conveniences. The community features several parks, including Kennedy Park and North Park, designed by renowned landscape architect Frederick Law Olmsted. Current rental trends show one-bedroom apartments averaging $1,590 and two-bedrooms at $1,850, reflecting a roughly 6% annual increase while remaining competitive for the region.
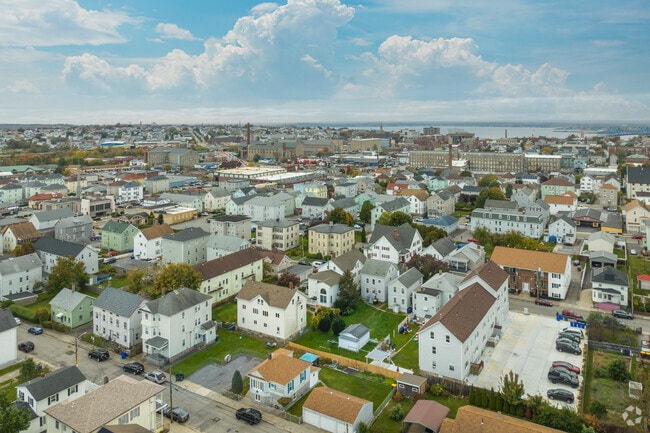
The city's neighborhoods each have their own character, from the Highlands with its Victorian-era homes to the waterfront district near Battleship Cove, which houses an impressive collection of World War II naval vessels. Portuguese heritage shapes the local culture, celebrated during events like the Great Feast of the Holy Ghost at Kennedy Park. Housing includes converted mill buildings, traditional triple-deckers, and newer apartments, particularly in the North End. Bristol Community College and the Narrows Center for the Arts contribute to the city's educational and cultural landscape. Located along Interstate 195, Fall River provides convenient access to Providence and Boston for commuters.
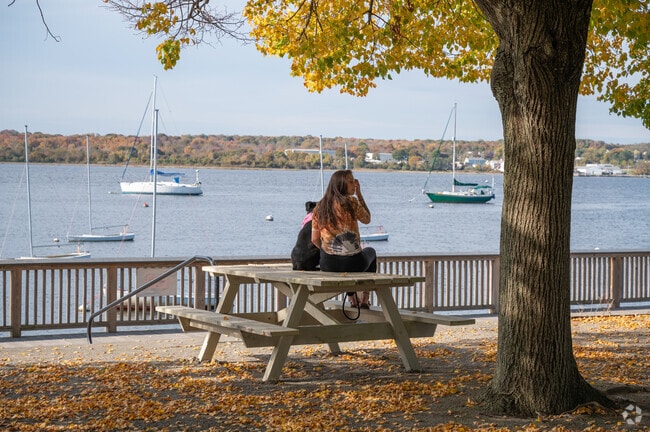
Downtown Fall River is a place to relax and enjoy watching the sail boats.
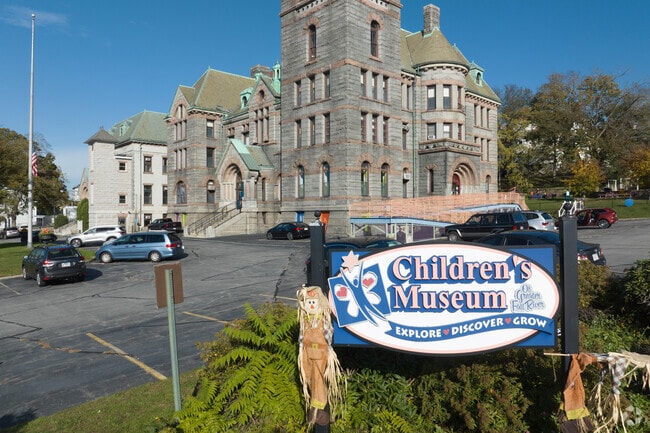
Downtown Fall River you can enjoy the Children's Museum.
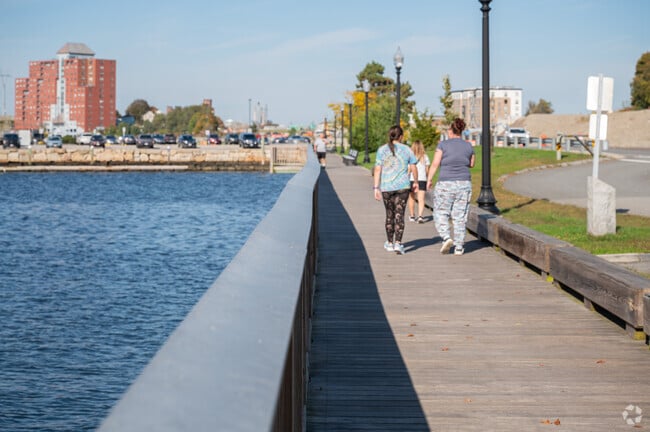
Stroll along the pier at Heritage State Park in Downtown Fall River.
Fall River Heritage State Park's boardwalk offers views of historic and modern ships.
Downtown Fall River's interesting architecture can be seen in this local church from the 1800s.
A local church's unique spire towers above the city in Downtown Fall River.
As of March 2026, the average apartment rent in Fall River, MA is $1,222 for a studio, $1,656 for one bedroom, $1,906 for two bedrooms, and $2,403 for three bedrooms. Apartment rent in Fall River has increased by 3.3% in the past year.
Explore how walkable, bikeable, drivable, and transit-friendly Fall River, MA is for everyday living.
Very Walkable
If you enjoy walking, you’ll enjoy renting in this area! It’s a very walkable neighborhood.
Some Transit
You'll likely want a car when living in this area since it has few transit options.
Bikeable
While there’s some bike infrastructure in this area, you’ll still need a car for many errands.
Public
Grades K-12

Public
Grades PK-8

Samuel Watson Elementary School
Public
Grades K-5
Public
Grades PK-5
Mary Fonseca Elementary School
Public
Grades PK-5
Public
Grades K-12
Argosy Collegiate Charter School
Public
Grades 6-12
Public
Grades PK-8
Public
Grades K-12

Public
Grades PK-8
Public
Grades K-12
Argosy Collegiate Charter School
Public
Grades 6-12
Diman Regional Vocational Technical High
Public
Grades 9-12
Public
Grades K-12
Public
Grades 9-12


19
Communities
2,684
Units
16
Cities
90
Communities
27,655
Units
77
Cities
55
Communities
10,912
Units
40
Cities

29
Communities
6,981
Units
25
Cities

18
Communities
3,894
Units
15
Cities
14
Communities
3,065
Units
11
Cities
† Our analysis of utilities, groceries, transportation, healthcare, home prices, and other goods and services is sourced from the Cost of Living Index, a respected benchmark published by the Council for Community and Economic Research (C2ER) that provides a thorough overview of living expenses across different regions.
Rent data is provided by CoStar Group’s Market Trend reports. As the industry leader in commercial real estate information, analytics, and news, CoStar conducts extensive research to produce and maintain a comprehensive database of commercial real estate information. We combine this data with public record to provide the most up-to-date rental information available.
Consumer goods, services, and home prices are sourced from the Cost of Living Index published by the Council for Community and Economic Research (C2ER). The data on this page is updated quarterly. It was last published in February 2026.


