Median Age
39 Years
Largest Age Group
30-39 Years
Approximately 15% of Residents
Under 20
24%
Over 65
18%




Avg Rent
$1,610
Population
93,005
Renter Mix
60% Rent
New Bedford combines maritime heritage with coastal living. This historic whaling port maintains its connection to the sea as America's leading fishing port by value, bringing in fresh seafood daily. The downtown showcases preserved 19th-century architecture, while the working waterfront continues its centuries-old traditions. Housing includes converted mill buildings and homes in the County Street Historic District, with rental rates averaging $1,391 for a one-bedroom apartment, showing a 4.9% increase over the past year. Notable areas include downtown, the North Bedford district, and the South End near Fort Taber Park.
The city's cultural scene centers around the New Bedford Whaling Museum and Buttonwood Park, which spans 97 acres of gardens, paths, and recreational spaces. The Feast of the Blessed Sacrament, North America's largest Portuguese festival, celebrates the city's Portuguese heritage each summer. UMass Dartmouth's College of Visual and Performing Arts contributes to downtown's arts community. New Bedford earned its nickname "The City That Lit the World" through its whaling industry's whale oil production, and now leads in offshore wind energy development. The waterfront continues to balance new development with its heritage as an active commercial fishing port.
Downtown New Bedford has a continuously growing arts and entertainment scene.
The Victory Park Children's Garden is a public garden available for free in New Bedford.
Every year thousands flock to New Bedford to enjoy the famous Feast of the Blessed Sacrament.
New Bedford's own PLAY Barcade is a local favorite where nostalgia meets stellar drinks.
New Bedford has maintained its affordability over the past several years.
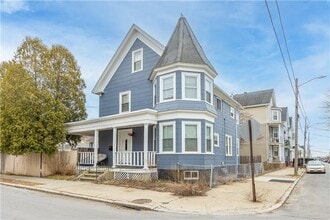
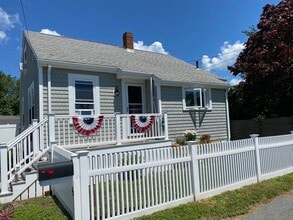
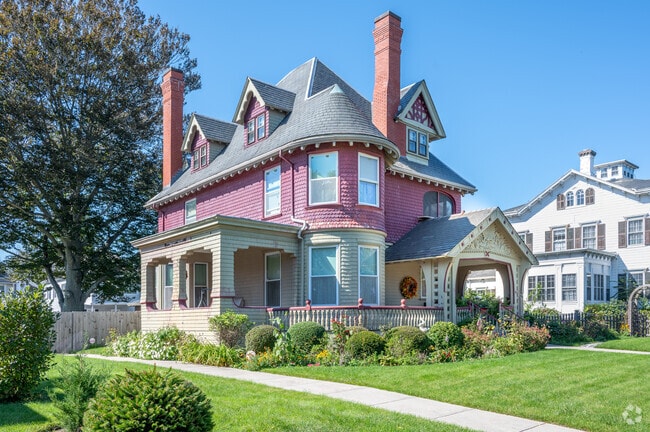
New Bedford homes along the shoreline evoke a classic Cape Cod aesthetic.
Median Household Income
$50,412
Average: $69,178
Education
15,290
Residents Have a Degree
Job Market
44,614
Workers Employed
Median Age
39 Years
Largest Age Group
30-39 Years
Approximately 15% of Residents
Under 20
24%
Over 65
18%
Housing Distribution
New Bedford has more renters than homeowners.

Education Distribution
Review this city's overall education levels.

As of August 2026, the average apartment rent in New Bedford, MA is $1,297 for a studio, $1,610 for one bedroom, $2,020 for two bedrooms, and $2,560 for three bedrooms. Apartment rent in New Bedford has increased by 6.5% in the past year.
Explore how walkable, bikeable, drivable, and transit-friendly New Bedford, MA is for everyday living.
Exceptionally Walkable
Walkability
Limited Public Transit
Transit
Moderately Drivable
Drivability
Fairly Bikeable
Bikeability

James B Congdon Elementary School
Public
Grades K-5
304 Students

Casimir Pulaski Elementary School
Public
Grades PK-5
592 Students

Elwyn G Campbell Elementary School
Public
Grades PK-5
285 Students
Carlos Pacheco Elementary School
Public
Grades K-5
246 Students
Public
Grades PK-5
221 Students
Public
Grades K-8
1,044 Students

Global Learning Charter Public School
Public
Grades K-12
501 Students

Public
Grades 6-8
922 Students

Public
Grades 6-8
918 Students
Public
Grades 6-8
779 Students
Global Learning Charter Public School
Public
Grades K-12
501 Students
Greater New Bedford Vocational Technical High School
Public
Grades 9-12
2,161 Students
Public
Grades 9-12
2,792 Students

Public
Grades 9-12
2,792 Students
Public
Grades K-12
87 Students
 The GreatSchools Rating helps parents compare schools within a state based on a variety of school quality indicators and provides a helpful picture of how effectively each school serves all of its students. Ratings are on a scale of 1 (below average) to 10 (above average) and can include test scores, college readiness, academic progress, advanced courses, equity, discipline and attendance data. We also advise parents to visit schools, consider other information on school performance and programs, and consider family needs as part of the school selection process.
View GreatSchools Rating Methodology
Data provided by
GreatSchools.org
© 2026. All rights reserved.
The GreatSchools Rating helps parents compare schools within a state based on a variety of school quality indicators and provides a helpful picture of how effectively each school serves all of its students. Ratings are on a scale of 1 (below average) to 10 (above average) and can include test scores, college readiness, academic progress, advanced courses, equity, discipline and attendance data. We also advise parents to visit schools, consider other information on school performance and programs, and consider family needs as part of the school selection process.
View GreatSchools Rating Methodology
Data provided by
GreatSchools.org
© 2026. All rights reserved.
† Our analysis of utilities, groceries, transportation, healthcare, home prices, and other goods and services is sourced from the Cost of Living Index, a respected benchmark published by the Council for Community and Economic Research (C2ER) that provides a thorough overview of living expenses across different regions.
Rent data is provided by CoStar Group’s Market Trend reports. As the industry leader in commercial real estate information, analytics, and news, CoStar conducts extensive research to produce and maintain a comprehensive database of commercial real estate information. We combine this data with public record to provide the most up-to-date rental information available.
Consumer goods, services, and home prices are sourced from the Cost of Living Index published by the Council for Community and Economic Research (C2ER). The data on this page is updated quarterly. It was last published in June 2026.
Demographic information comes from Neustar and combines detailed address data with U.S. Census and American Community Survey statistics to produce reliable local estimates.