
Ironworks at Old Town
711 Astor St,
Bellingham, WA 98225
$1,550 - $2,475
Studio - 2 Beds
Area Guide
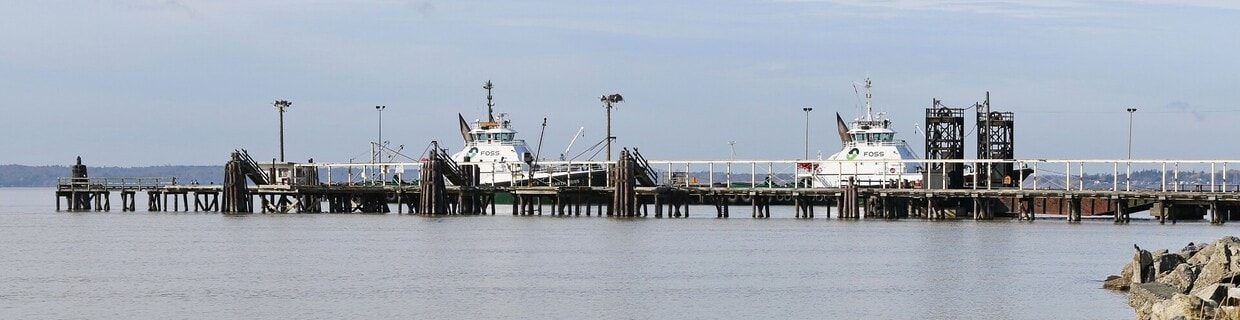
With the Cascade Mountains in the background and sitting along Bellingham Bay, Downtown Bellingham provides more than a beautiful landscape. For those who enjoy outdoor activities, an apartment in Downtown Bellingham is ideal -- nearby activities include boating, skiing, snowboarding, mountain biking, hiking, kayaking, and camping. There's even an event that highlights Bellingham's fantastic adventures: the Ski to Sea Race, which begins as a ski race on Mount Baker and ends with kayaking on the bay. The seven-leg race is held over Memorial Day weekend and dates back to 1911.
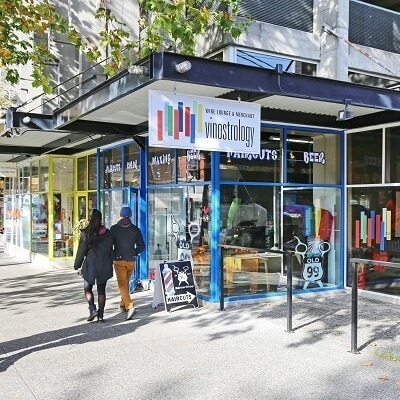
Downtown Bellingham is a pedestrian-friendly shopping district, filled with gift stores, art galleries, boutiques, and more. Downtown Bellingham is next door to another favorite shopping district, the Historic Fairhaven District. Western Washington University is a few blocks south of Downtown Bellingham, and students often bike ride or walk downtown.
Hotspots include the Upfront Theatre, the Wild Buffalo House of Music, Mindport Exhibits, and the SPARK Museum of Electrical Invention. The Bellingham Farmers Market, voted one of the top farmers markets in the Pacific Northwest, is located off East Maple Street near Railroad Avenue. Downtown Sounds takes place every summer, taking place on Bay and Prospect Streets. The Bellingham Festival of Music is another popular music festival, held in July.
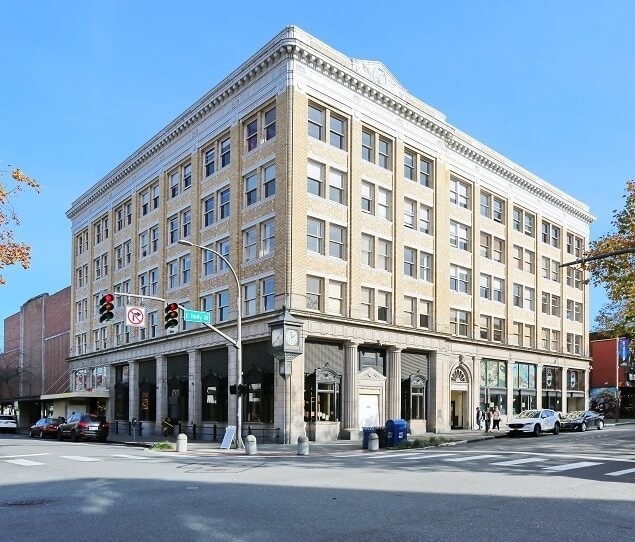
A historic clock adorns the Bellingham National Bank building
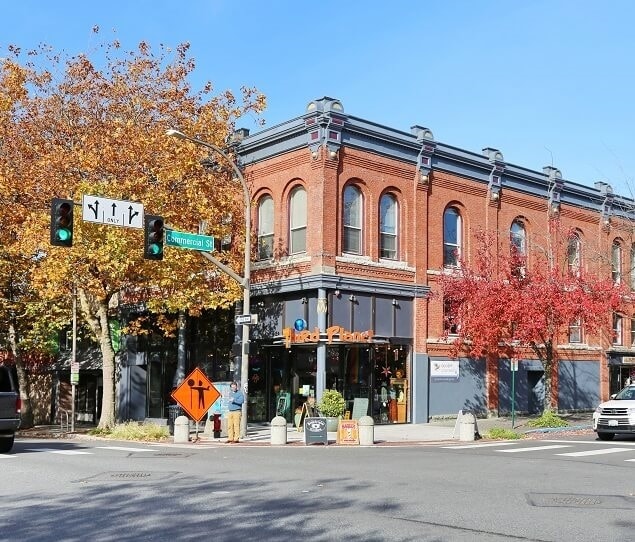
The historic Red Front Building was built in 1900 as Samuel Altshuler’s Red Front Clothing Store
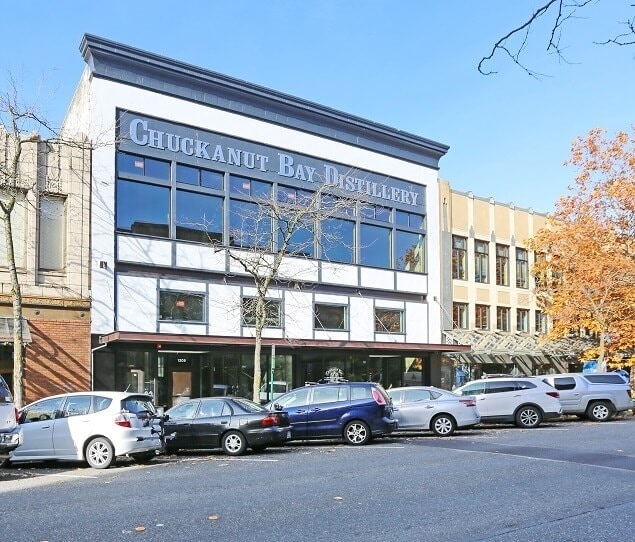
The award-winning Chuckanut Bay Distillery includes a tasting room and a retail shop
Avenue Bread’s Railroad Café served as the original bakery location in 1995
As of August 2026, the average apartment rent in Downtown Bellingham is $1,333 for a studio, $1,555 for one bedroom, $2,182 for two bedrooms, and $2,158 for three bedrooms. Apartment rent in Downtown Bellingham has increased by 1.6% in the past year.
Studio
416 sq ft
Average Sq Ft
$1,333/month
Average Rent
1 BR
560 sq ft
Average Sq Ft
$1,555/month
Average Rent
2 BR
866 sq ft
Average Sq Ft
$2,182/month
Average Rent
3 BR
1,156 sq ft
Average Sq Ft
$2,158/month
Average Rent
Explore how walkable, bikeable, drivable, and transit-friendly Downtown Bellingham - Bellingham, WA is for everyday living.
Fairly Walkable
Walkability
Limited Public Transit
Transit
Exceptionally Drivable
Drivability
Fairly Bikeable
Bikeability
Downtown Bellingham - Bellingham, WA offers all daily essentials, but they’re limited to a few main areas.
Supermarket Within a 15 Minute Walk
Groceries
Good Restaurant Variety Nearby
Restaurants
Good Café Variety Nearby
Cafes
Fair Variety of Shops Nearby
Shopping
Get a sense of what it’s like to live in Downtown Bellingham - Bellingham, WA from everyday activity to noise and nightlife.
Mostly Calm Atmosphere
Vibrancy
Great Nightlife Variety Nearby
Nightlife
Not Noisy
Quiet Score
† Our analysis of utilities, groceries, transportation, healthcare, home prices, and other goods and services is sourced from the Cost of Living Index, a respected benchmark published by the Council for Community and Economic Research (C2ER) that provides a thorough overview of living expenses across different regions.
Rent data is provided by CoStar Group’s Market Trend reports. As the industry leader in commercial real estate information, analytics, and news, CoStar conducts extensive research to produce and maintain a comprehensive database of commercial real estate information. We combine this data with public record to provide the most up-to-date rental information available.
Consumer goods, services, and home prices are sourced from the Cost of Living Index published by the Council for Community and Economic Research (C2ER). The data on this page is updated quarterly. It was last published in June 2026.
Demographic information comes from Neustar and combines detailed address data with U.S. Census and American Community Survey statistics to produce reliable local estimates.


