Median Age
45 Years
Largest Age Group
55-64 Years
Approximately 14% of Residents
Under 20
20%
Over 65
22%
Avg Rent
$2,482
Population
53,415
Renter Mix
26% Rent
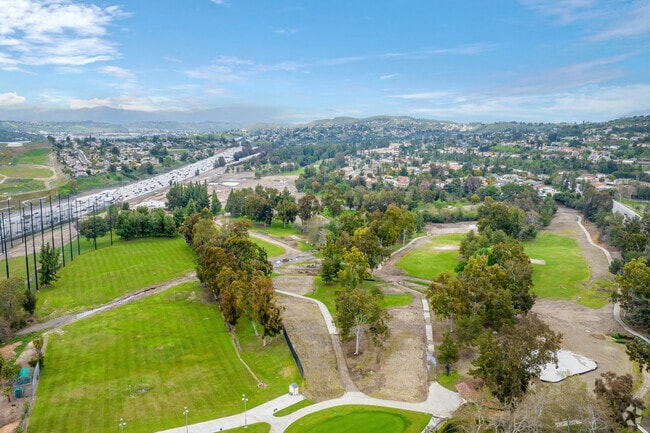
Who wouldn’t want to live along Southern California’s rolling hills in the affluent suburbs of Diamond Bar? This primarily residential area offers picturesque neighborhoods, open green space, golf courses, community parks, and so much more. In fact, the city almost appears like a massive park itself.
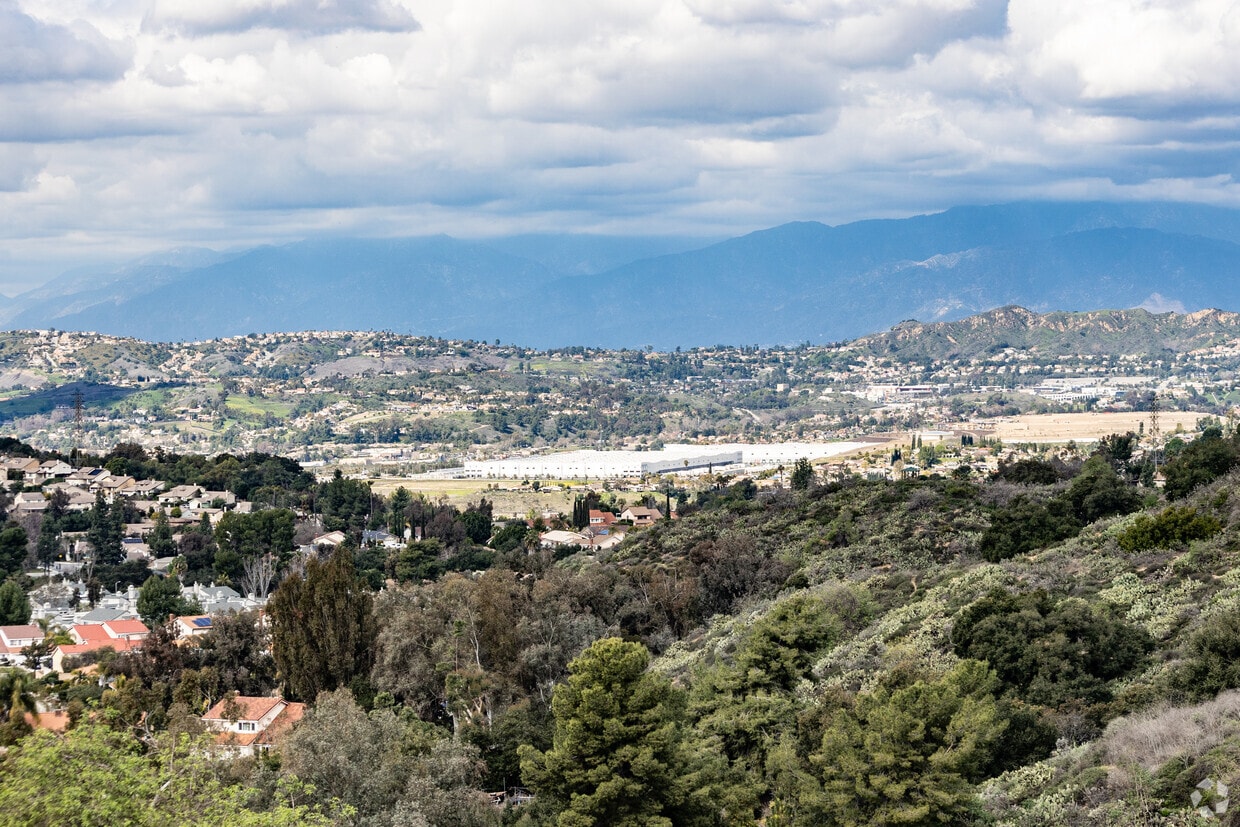
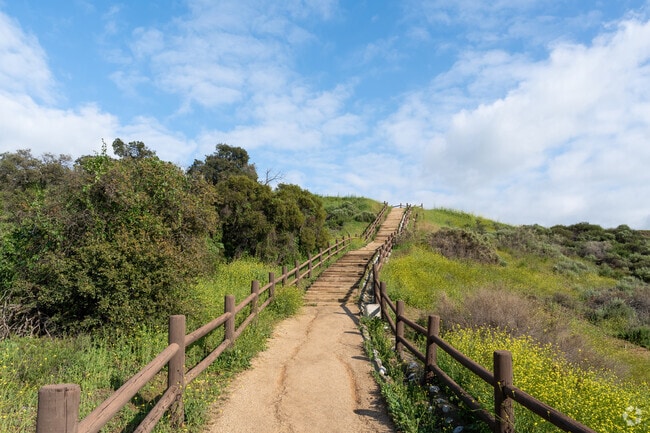
You’ll love the safe streets and scenic views from city parks such as Pantera Park and Sycamore Canyon Park. Enjoy nature trails, dog parks, and beautiful views of Southern California’s sprawling mountain ranges from Diamond Bar’s open green spaces.
Excellent schools are offered in the Walnut Valley Unified School District, and there’s always time to tee off at Diamond Bar Golf Course in this tranquil city. On the edge of town, you’ll discover a train that takes you straight to Los Angeles’ Union Station, with Diamond Bar located just 28 miles east of Downtown LA. Discover all of the wonderful attractions, nearby amenities, tight-knit community, and upscale apartments and houses in this family-friendly suburbia.
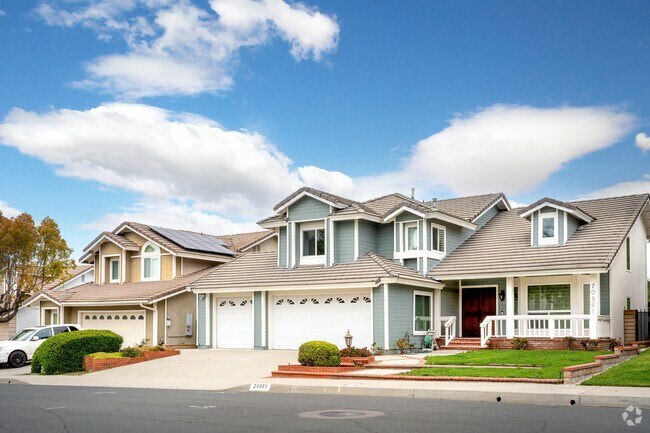
Diamond Bar is full of large homes with three car garages.
Diamond Bar offers locals an idyllic residential retreat from the hive of activity in LA.
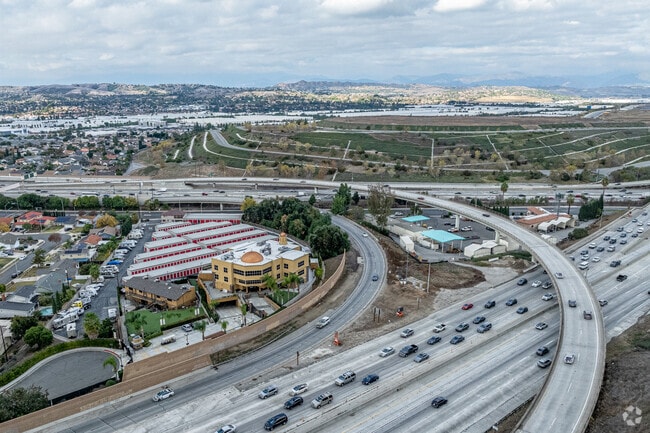
The Institute of Knowledge in Diamond Bar is right off of the 57 and 60 fwy
Pantera Park has a dog park, hiking trails, basketball courts, baseball fields and great views.
Grid Coffee is popular with students for studying and caffeine.
The Diamond Bar Public Library has shelves of media waiting to entertain and educate.
Median Household Income
$107,062
Average: $130,379
Education
23,155
Residents Have a Degree
Job Market
27,197
Workers Employed
Median Age
45 Years
Largest Age Group
55-64 Years
Approximately 14% of Residents
Under 20
20%
Over 65
22%
Housing Distribution
Diamond Bar has more homeowners than renters.

Education Distribution
Review this city's overall education levels.

As of July 2026, the average apartment rent in Diamond Bar, CA is $2,477 for one bedroom, $2,767 for two bedrooms, and $2,994 for three bedrooms. Apartment rent in Diamond Bar has increased by 2.3% in the past year.
Explore how walkable, bikeable, drivable, and transit-friendly Diamond Bar, CA is for everyday living.
Fairly Walkable
Walkability
Limited Public Transit
Transit
Exceptionally Drivable
Drivability
Fairly Bikeable
Bikeability
Public
Grades K-5
684 Students

Public
Grades K-5
684 Students
Public
Grades K-5
556 Students
Public
Grades K-5
512 Students
Public
Grades K-5
512 Students
Public
Grades 6-8
1,349 Students
Public
Grades 6-8
1,349 Students

Public
Grades 6-8
688 Students

Public
Grades 6-8
688 Students

Public
Grades 9-12
2,563 Students
Public
Grades 9-12
2,563 Students
† Our analysis of utilities, groceries, transportation, healthcare, home prices, and other goods and services is sourced from the Cost of Living Index, a respected benchmark published by the Council for Community and Economic Research (C2ER) that provides a thorough overview of living expenses across different regions.
Rent data is provided by CoStar Group’s Market Trend reports. As the industry leader in commercial real estate information, analytics, and news, CoStar conducts extensive research to produce and maintain a comprehensive database of commercial real estate information. We combine this data with public record to provide the most up-to-date rental information available.
Consumer goods, services, and home prices are sourced from the Cost of Living Index published by the Council for Community and Economic Research (C2ER). The data on this page is updated quarterly. It was last published in June 2026.
Demographic information comes from Neustar and combines detailed address data with U.S. Census and American Community Survey statistics to produce reliable local estimates.


