
Current At The Banks
121 E Freedom Way,
Cincinnati, OH 45202
$1,118 - $4,084
Studio - 2 Beds


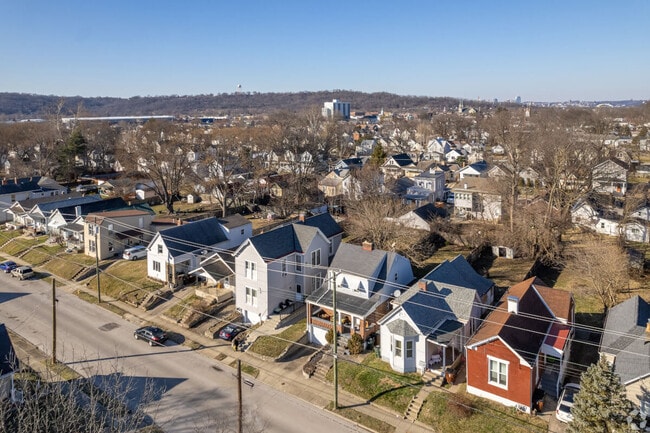

Covington is a vibrant suburban city located directly across the Ohio River from Cincinnati. The north side of the city is well known for its stunning historic architecture, from the numerous magnificent churches to the iconic John A. Roebling Suspension Bridge (connecting Covington with Cincinnati) to the brick townhomes of the Mutter Gottes Historic District. Farther south, things spread out considerably as the urban layout begins to blend into the surrounding countryside.
The local rental market is huge and diverse, ranging from upscale historic homes and swanky downtown condos to sensible suburban homes to budget-friendly efficiency apartments. The variety of housing options combined with the easy access to Cincinnati has bade Covington a longtime favorite for commuters, and frequent travelers will love the close proximity to Cincinnati/Northern Kentucky International Airport.
The Roebling Murals in Downtown Covington tell the history of the region from 8000 B.C. to 2008.
Covington offers big-city benefits in a walkable community that oozes small-town charm.
The water view at George Rogers Clark Park.
As of March 2026, the average apartment rent in Covington, KY is $1,278 for a studio, $1,364 for one bedroom, $1,861 for two bedrooms, and $1,674 for three bedrooms. Apartment rent in Covington has increased by 0.2% in the past year.
The cost of living in Covington, KY is 13.0% lower than the national average. Generally, housing in Covington is 27.9% less expensive than the national average, with rent falling between $1,278 - $1,861. You can expect to pay 10.8% less for groceries, 7.0% less for utilities, and 2.2% more for transportation.
Explore how walkable, bikeable, drivable, and transit-friendly Covington, KY is for everyday living.
Very Walkable
If you enjoy walking, you’ll enjoy renting in this area! It’s a very walkable neighborhood.
Some Transit
You'll likely want a car when living in this area since it has few transit options.
Bikeable
While there’s some bike infrastructure in this area, you’ll still need a car for many errands.
Public
Grades K-5

Ryland Heights Elementary School
Public
Grades PK-5
Public
Grades PK-5
Public
Grades PK-5

Public
Grades K-5

Public
Grades 6-8

Public
Grades K-12
11 Students
Public
Grades 9-12

Public
Grades K-12
11 Students

10
Communities
2,053
Units
4
Cities

24
Communities
3,739
Units
17
Cities
23
Communities
2,900
Units
11
Cities

29
Communities
2,888
Units
4
Cities

56
Communities
13,563
Units
40
Cities

67
Communities
12,012
Units
28
Cities
† Our analysis of utilities, groceries, transportation, healthcare, home prices, and other goods and services is sourced from the Cost of Living Index, a respected benchmark published by the Council for Community and Economic Research (C2ER) that provides a thorough overview of living expenses across different regions.
Rent data is provided by CoStar Group’s Market Trend reports. As the industry leader in commercial real estate information, analytics, and news, CoStar conducts extensive research to produce and maintain a comprehensive database of commercial real estate information. We combine this data with public record to provide the most up-to-date rental information available.
Consumer goods, services, and home prices are sourced from the Cost of Living Index published by the Council for Community and Economic Research (C2ER). The data on this page is updated quarterly. It was last published in February 2026.


