
Broadstone Overlands
5000 Collina Ter,
Clermont, FL 34711
$1,841 - $4,596 Total Monthly Price
1-3 Beds
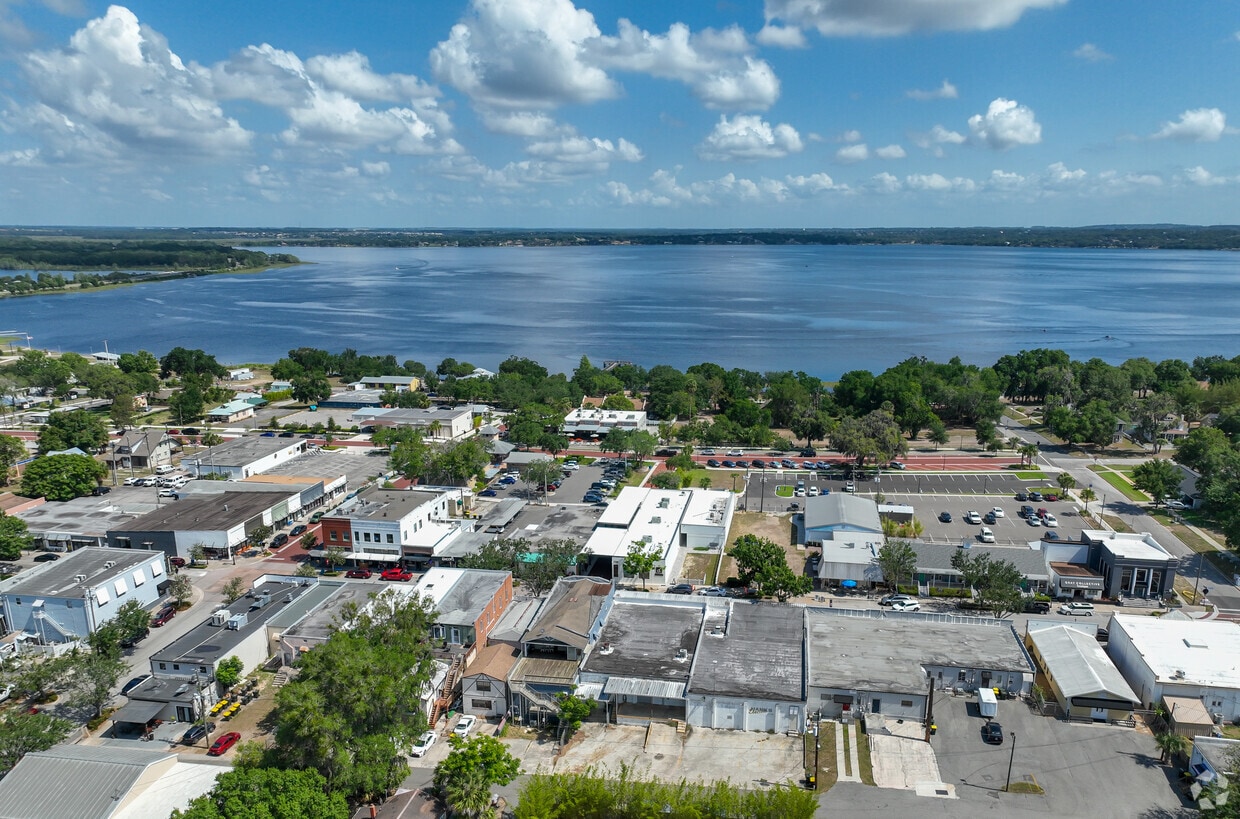
Nestled in the rolling hills of Central Florida, Clermont stands out with its distinctive elevation changes amid the state's typically flat landscape. The city centers around the scenic Clermont Chain of Lakes, offering abundant outdoor recreation opportunities. The rental market currently shows average rates of $1,528 for one-bedroom units, $1,809 for two bedrooms, and $2,150 for three-bedroom homes, with properties featuring spacious floor plans. The Lake Minneola area has become a residential hub, anchored by Waterfront Park with its swimming areas, fishing piers, and extensive trail system spanning 40 miles.
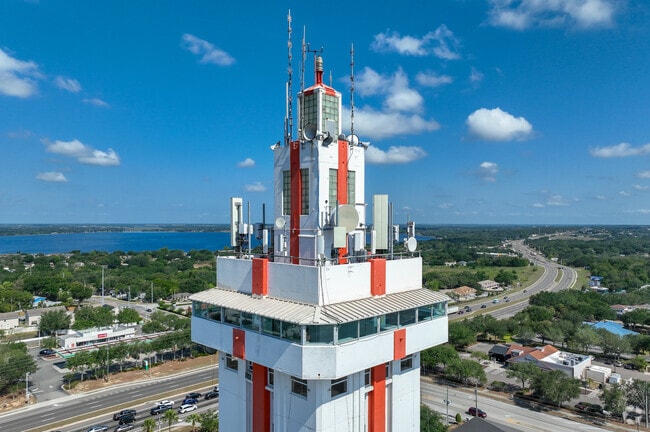
Located 22 miles west of Orlando, Clermont has evolved from its agricultural beginnings into a thriving suburban community. The downtown district features independent retailers and restaurants alongside the historic Clermont Performing Arts Center. The Florida Citrus Tower remains an enduring landmark, offering panoramic views of the surrounding landscape. Housing options include apartment communities and single-family homes throughout neighborhoods like Kings Ridge and Highland Lakes. The presence of Lake-Sumter State College and the University of Central Florida's shared campus enhances educational opportunities in the area. Clermont's combination of outdoor recreation, proximity to Orlando, and community amenities continues to attract new residents to the area.
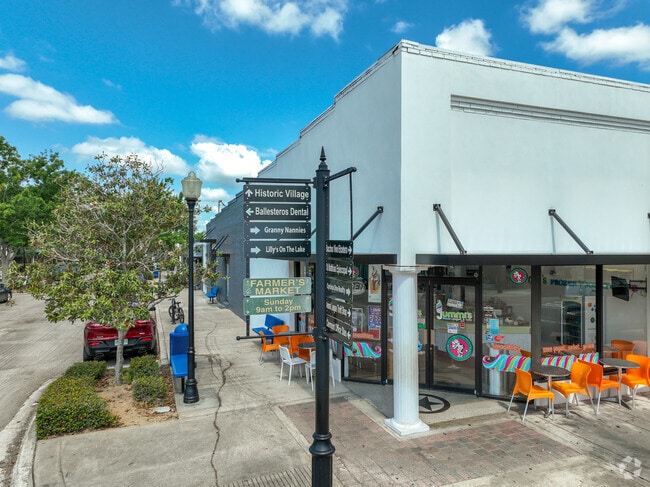
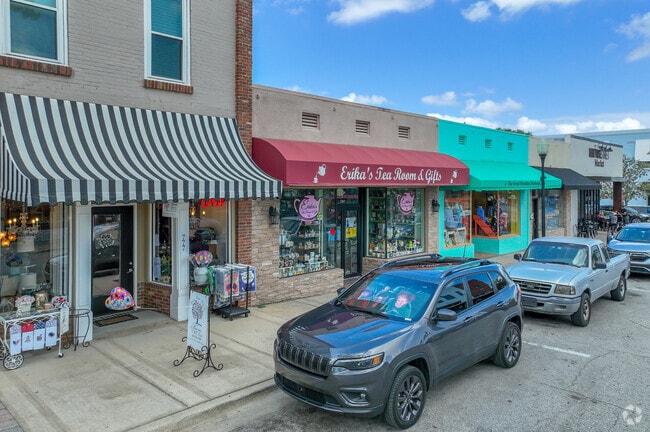
Historic Downtown Clermont Has a Farmer's Market Every Weekend, Over 60 Shops and Restaurants, Multiple Art Galleries and It's Own Museum
Historic Downtown Clermont Has Over 60 Shops and Restaurants
Disney World is a short 20 minute drive from Sawgrass Bay.
Showcase of Citrus is a highly rated destination in Sawgrass Bay.
Some neighborhoods feature ranch style homes and large oak trees in Sawgrass Bay.
Enjoy the local produce at the Farmers Market at nearby Cagan Crossing.
As of March 2026, the average apartment rent in Clermont, FL is $944 for a studio, $1,523 for one bedroom, $1,806 for two bedrooms, and $2,102 for three bedrooms. Apartment rent in Clermont has decreased by -1.1% in the past year.
Explore how walkable, bikeable, drivable, and transit-friendly Clermont, FL is for everyday living.
Car-Dependent
This area is considered a car-dependent area and most errands will require a car.
Somewhat Bikeable
You might be able to find places to ride your bike in this area, but you’ll most likely want your car for most errands.
Cypress Ridge Elementary School
Public
Grades PK-5

Public
Grades K-8

Public
Grades PK-5
Public
Grades PK-5

Sawgrass Bay Elementary School
Public
Grades PK-5

Public
Grades 6-8

Public
Grades K-8
Public
Grades 6-8
Public
Grades 6-8
583 Students
Public
Grades 9-12


30
Communities
5,743
Units
13
Cities

3,489
Communities
959,639
Units
894
Cities

43
Communities
12,442
Units
37
Cities

40
Communities
13,620
Units
30
Cities

390
Communities
119,597
Units
158
Cities

347
Communities
103,303
Units
139
Cities
† Our analysis of utilities, groceries, transportation, healthcare, home prices, and other goods and services is sourced from the Cost of Living Index, a respected benchmark published by the Council for Community and Economic Research (C2ER) that provides a thorough overview of living expenses across different regions.
Rent data is provided by CoStar Group’s Market Trend reports. As the industry leader in commercial real estate information, analytics, and news, CoStar conducts extensive research to produce and maintain a comprehensive database of commercial real estate information. We combine this data with public record to provide the most up-to-date rental information available.
Consumer goods, services, and home prices are sourced from the Cost of Living Index published by the Council for Community and Economic Research (C2ER). The data on this page is updated quarterly. It was last published in February 2026.


