Median Age
39 Years
Largest Age Group
10-19 Years
Approximately 15% of Residents
Under 20
27%
Over 65
17%
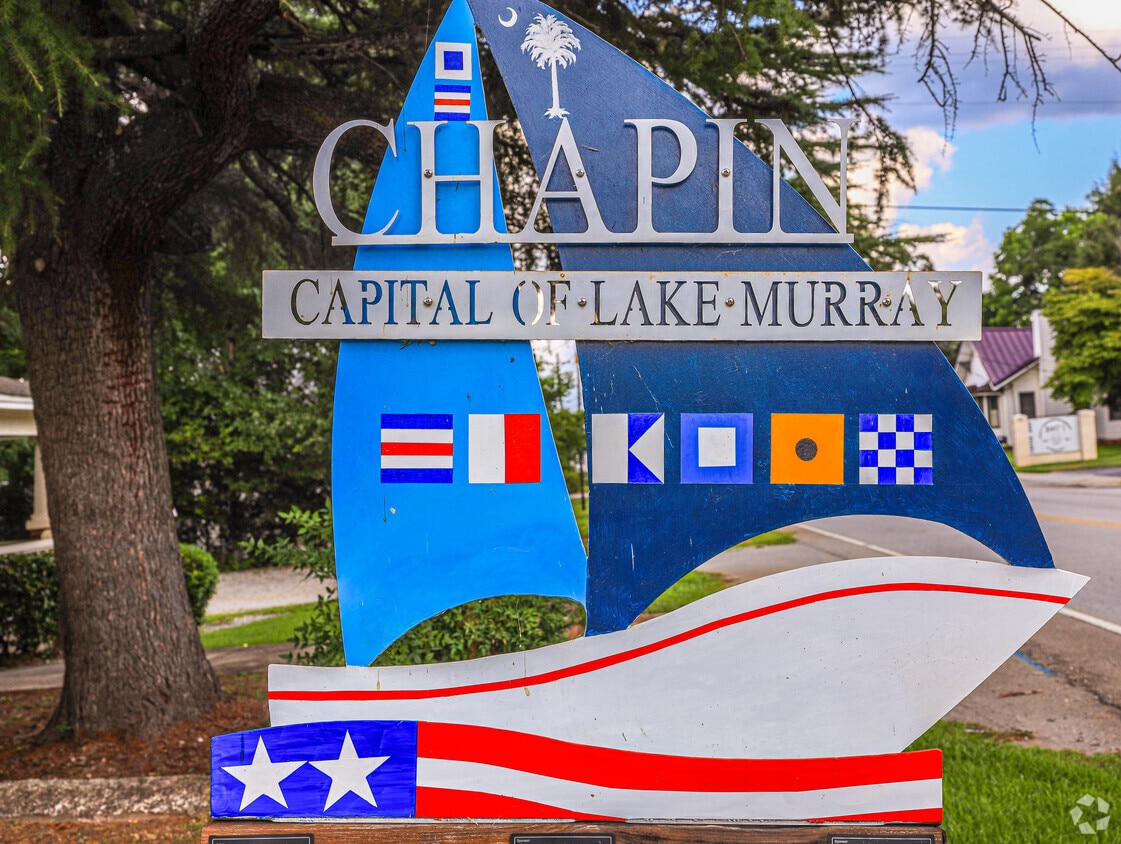

Chapin sits between Lake Murray and Interstate 26, about 23 miles northwest of Downtown Columbia. Known to locals as the “capital of Lake Murray,” Chapin mixes all the appeal of a small town — friendly locals and community — with the liveliness of bigger locale because of the lake to the south. There are notable festivals year round, specifically the Labor Day Festival that runs for three days.
Downtown Chapin is full of appeal with its historic buildings and plentiful restaurants. There’s also a number of fantastic schools that serve the area, making this a fantastic option for families who like to stay active or just enjoy the water. There’s not much nightlife in Chapin, but the buzz of the city is just a 30-minute drive away.
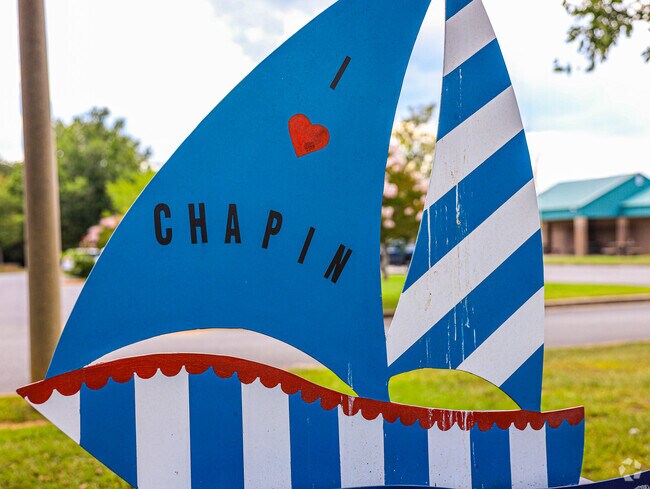
Boat themed signs are found all throughout Chapin.
Artists make their mark in Chapin with boat-shaped sculptures placed throughout the town.
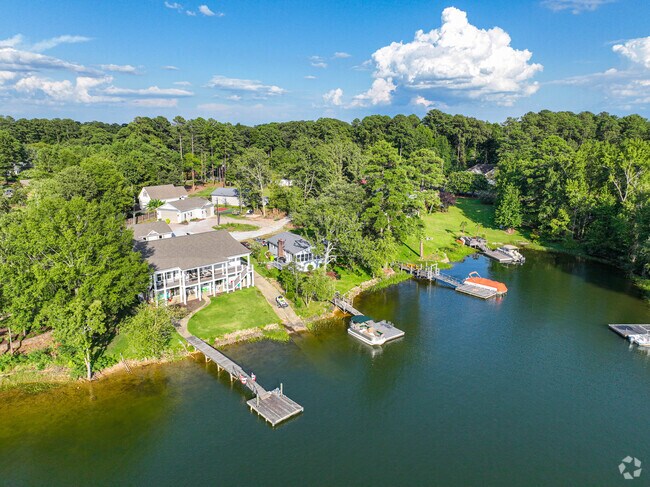
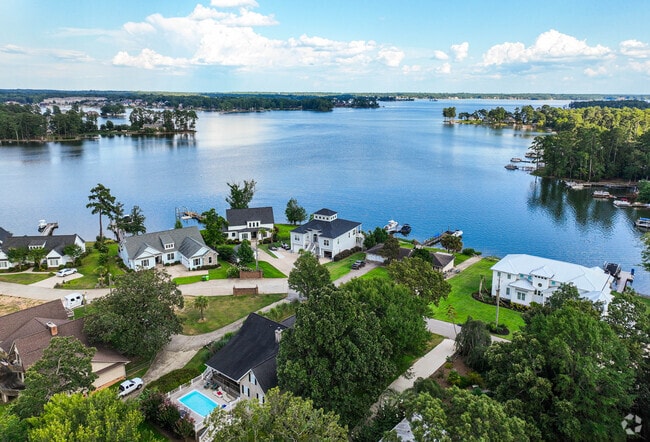
Chapin is a scenic lakefront community.
S&S Destination is a restaurant at the heart of Chapin.
Town Center is a quaint historic area lined with shops and restaurants.
Boating is a popular pastime in Chapin.
Median Household Income
$71,881
Average: $89,535
Education
438
Residents Have a Degree
Job Market
864
Workers Employed
Median Age
39 Years
Largest Age Group
10-19 Years
Approximately 15% of Residents
Under 20
27%
Over 65
17%
Housing Distribution
Chapin has more homeowners than renters.

Education Distribution
Review this city's overall education levels.

Explore how walkable, bikeable, drivable, and transit-friendly Chapin, SC is for everyday living.
Somewhat Walkable
Walkability
Exceptionally Drivable
Drivability
Somewhat Bikeable
Bikeability
Public
Grades K-5
985 Students

Public
Grades K-5
809 Students

Public
Grades K-5
809 Students
Public
Grades PK-5
790 Students
Public
Grades PK-5
767 Students
Public
Grades 6-8
1,007 Students

Public
Grades 9-12
1,615 Students

Public
Grades 9-12
1,615 Students
Public
Grades 9-12
1,118 Students
Public
Grades 9-12
536 Students

Center for Advanced Technical Studies
Public
Grades 9-12

† Our analysis of utilities, groceries, transportation, healthcare, home prices, and other goods and services is sourced from the Cost of Living Index, a respected benchmark published by the Council for Community and Economic Research (C2ER) that provides a thorough overview of living expenses across different regions.
Rent data is provided by CoStar Group’s Market Trend reports. As the industry leader in commercial real estate information, analytics, and news, CoStar conducts extensive research to produce and maintain a comprehensive database of commercial real estate information. We combine this data with public record to provide the most up-to-date rental information available.
Consumer goods, services, and home prices are sourced from the Cost of Living Index published by the Council for Community and Economic Research (C2ER). The data on this page is updated quarterly. It was last published in June 2026.
Demographic information comes from Neustar and combines detailed address data with U.S. Census and American Community Survey statistics to produce reliable local estimates.


