Median Age
40 Years
Largest Age Group
35-44 Years
Approximately 14% of Residents
Under 20
25%
Over 65
19%


Avg Rent
$1,351
Population
21,176
Renter Mix
33% Rent
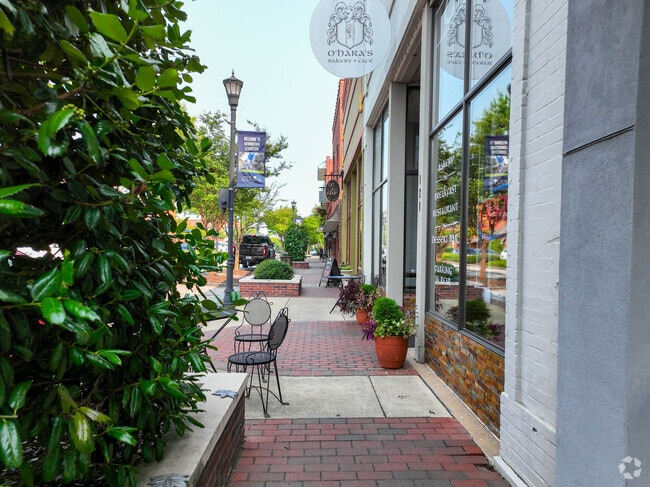
Located 12 miles west of Columbia, Lexington combines small-town hospitality with suburban convenience. This growing community offers diverse housing options, from newer apartment communities to established neighborhoods. Current rental rates average $1,325 for one-bedroom units and $1,476 for two-bedroom homes, with recent rate changes ranging from 1.8% to 5.2% across different unit sizes.
Lake Murray serves as a central attraction, where the 1.7-mile dam provides space for walking, biking, and swimming during warmer months. The Icehouse Amphitheater anchors the local entertainment scene with regular concerts and events, while the Lexington Community Band performs throughout the year. Outdoor enthusiasts can explore the Fourteen-Mile Creek Trail or visit Gibson Pond Park, which reopened in 2021 following restoration work. The downtown area comes alive during the weekly farmers' market, offering fresh produce and local goods. Major employers in the area include Lexington School District 1, contributing to the town's steady growth in the Midlands region.
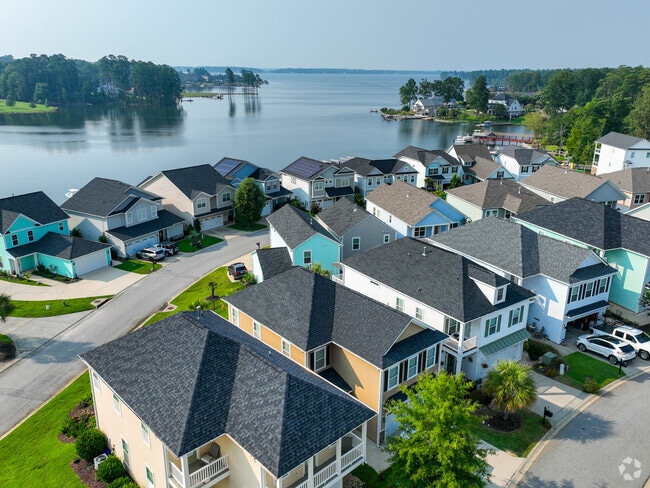
Lexington offers new construction overlooking Lake Murray.
Boat landings are on every corner of Lake Murray in Lexington.
Median Household Income
$74,470
Average: $94,231
Education
8,028
Residents Have a Degree
Job Market
10,724
Workers Employed
Median Age
40 Years
Largest Age Group
35-44 Years
Approximately 14% of Residents
Under 20
25%
Over 65
19%
Housing Distribution
Lexington has more homeowners than renters.

Education Distribution
Review this city's overall education levels.

As of July 2026, the average apartment rent in Lexington, SC is $1,351 for one bedroom, $1,510 for two bedrooms, and $1,721 for three bedrooms. Apartment rent in Lexington has increased by 1.8% in the past year.
Explore how walkable, bikeable, drivable, and transit-friendly Lexington, SC is for everyday living.
Somewhat Walkable
Walkability
Exceptionally Drivable
Drivability
Somewhat Bikeable
Bikeability
Public
Grades PK-5
891 Students

Public
Grades PK-5
891 Students
Public
Grades PK-5
901 Students

Public
Grades PK-5
901 Students
Public
Grades PK-5
863 Students
Public
Grades 6-8
808 Students

Public
Grades 6-8
778 Students
Public
Grades 6-8
748 Students
Public
Grades 6-8
748 Students
Public
Grades 6-8
893 Students

Public
Grades 9-12
2,410 Students
Public
Grades 9-12
2,410 Students
Public
Grades 9-12
2,197 Students
Public
Grades 9-12
2,117 Students
Public
Grades 9-12
2,204 Students

† Our analysis of utilities, groceries, transportation, healthcare, home prices, and other goods and services is sourced from the Cost of Living Index, a respected benchmark published by the Council for Community and Economic Research (C2ER) that provides a thorough overview of living expenses across different regions.
Rent data is provided by CoStar Group’s Market Trend reports. As the industry leader in commercial real estate information, analytics, and news, CoStar conducts extensive research to produce and maintain a comprehensive database of commercial real estate information. We combine this data with public record to provide the most up-to-date rental information available.
Consumer goods, services, and home prices are sourced from the Cost of Living Index published by the Council for Community and Economic Research (C2ER). The data on this page is updated quarterly. It was last published in June 2026.
Demographic information comes from Neustar and combines detailed address data with U.S. Census and American Community Survey statistics to produce reliable local estimates.


