Median Age
29 Years
Largest Age Group
20-29 Years
Approximately 28% of Residents
Under 20
24%
Over 65
14%

Avg Rent
$1,536
Population
60,231
Renter Mix
56% Rent
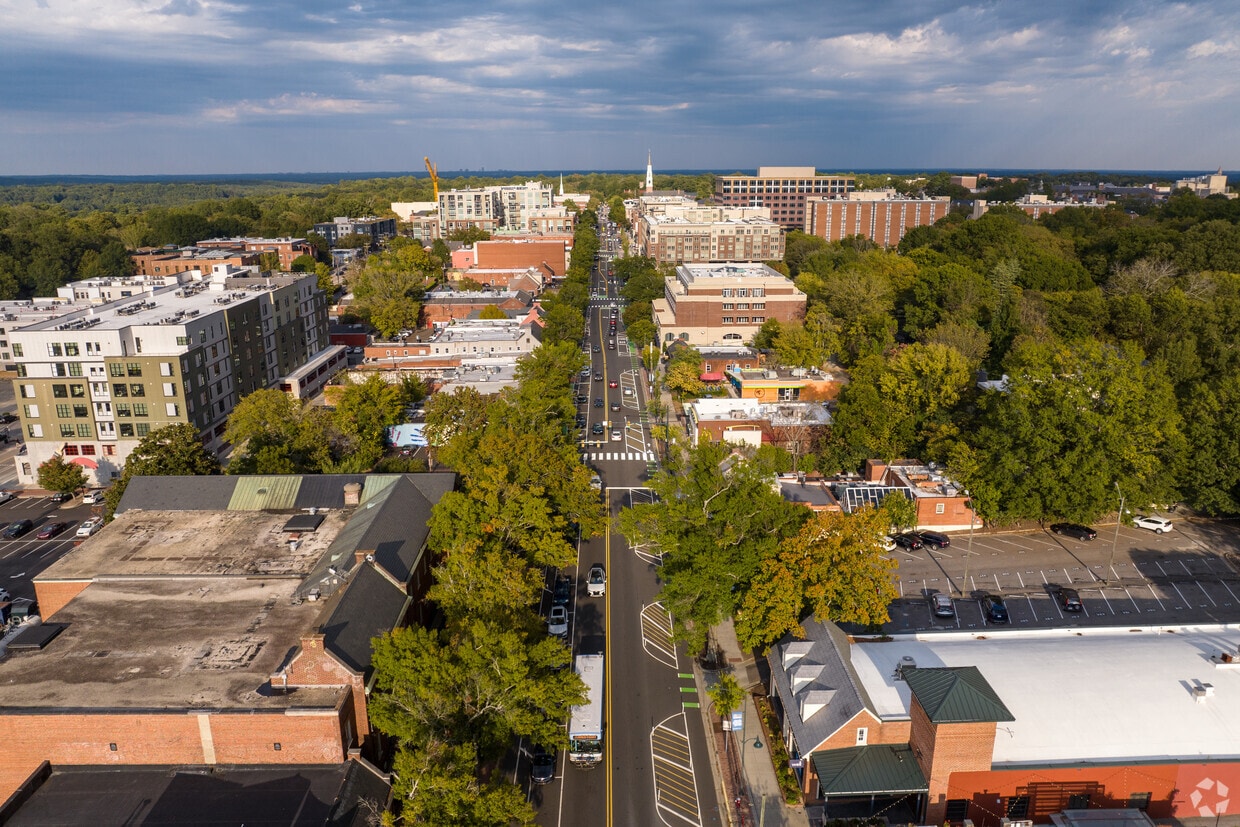
Chapel Hill, home to the University of North Carolina, combines historic architecture with contemporary living in North Carolina's Research Triangle. Franklin Street serves as the town's central hub, where local shops and restaurants create a lively atmosphere. The rental market offers various options, with one-bedroom apartments averaging $1,535 monthly, two-bedroom units at $1,781, and three-bedroom apartments at $2,314. The Southern Village and Meadowmont areas feature apartments and homes connected by walking paths and community spaces.
The town maintains extensive green spaces, including the Bolin Creek Trail and Battle Branch Trail system. Cultural attractions include Memorial Hall performances and the Ackland Art Museum's collections. The historic Morehead Planetarium and Science Center stands as an educational landmark on the UNC campus. During basketball season, the Dean Smith Center comes alive with Tar Heels games. Chapel Hill's distinctive features include the Carolina blue fire trucks and the Morehead Planetarium's sundial, adding to the town's character.
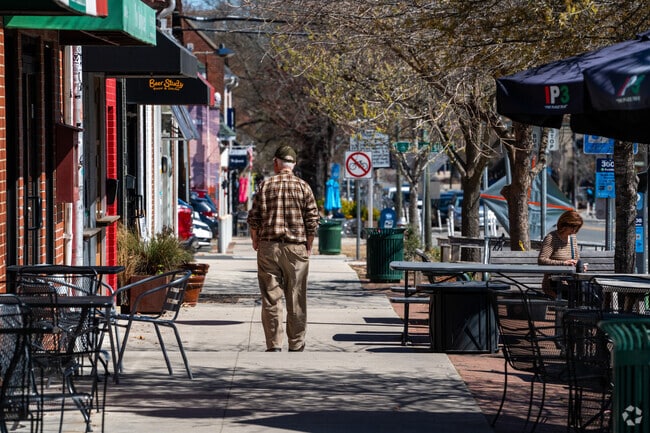
People walk and bike to amenities within the Chapel Hill neighborhood.
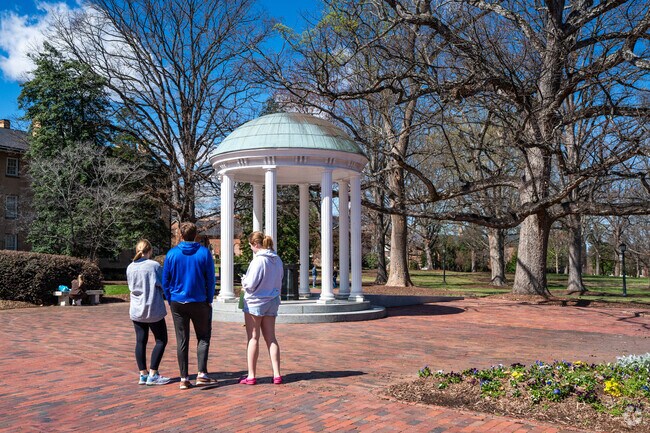
UNC is a five-minute drive from Meadowmont.
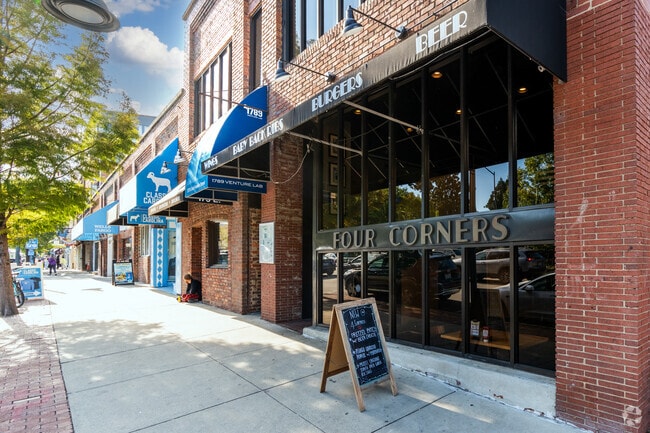
Downtown Chapel Hill exudes small-town charm.
Umstead Park in Chapel Hill provides walking and biking trails along Bolin Creek.
Jordan Lake State Recreation Area is a popular source of outdoor recreation near Chapel Hill.
Franklin Street gets crowded when schools are back in Chapel Hill.
Median Household Income
$81,814
Average: $118,920
Education
30,735
Residents Have a Degree
Job Market
28,149
Workers Employed
Median Age
29 Years
Largest Age Group
20-29 Years
Approximately 28% of Residents
Under 20
24%
Over 65
14%
Housing Distribution
Chapel Hill has more renters than homeowners.

Education Distribution
Review this city's overall education levels.

As of July 2026, the average apartment rent in Chapel Hill, NC is $1,525 for a studio, $1,535 for one bedroom, $1,827 for two bedrooms, and $2,644 for three bedrooms. Apartment rent in Chapel Hill has decreased by -0.8% in the past year.
The cost of living in Chapel Hill, NC is 5.4% higher than the national average. Generally, housing in Chapel Hill is 17.3% more expensive than the national average, with rent falling between $1,525 - $2,644. You can expect to pay 1.2% more for groceries, 11.8% less for utilities, and 8.5% less for transportation.
Compare Cities
Explore how walkable, bikeable, drivable, and transit-friendly Chapel Hill, NC is for everyday living.
Fairly Walkable
Walkability
Some Public Transit
Transit
Very Drivable
Drivability
Fairly Bikeable
Bikeability
Public
Grades K-5
421 Students

Morris Grove Elementary School
Public
Grades K-5
421 Students
Public
Grades K-5
394 Students
Public
Grades PK-5
616 Students

Public
Grades K-5
433 Students
Public
Grades 6-8
658 Students
R D And Euzelle Smith Middle School
Public
Grades 6-8
768 Students

Public
Grades 6-8
752 Students
Public
Grades 6-8
609 Students
Margaret B. Pollard Middle School
Public
Grades 6-8
744 Students

Public
Grades 9-12
1,597 Students
Public
Grades 9-12
1,597 Students
Public
Grades 9-12
1,447 Students
Public
Grades 9-12
1,387 Students
Public
Grades K-12
508 Students
† Our analysis of utilities, groceries, transportation, healthcare, home prices, and other goods and services is sourced from the Cost of Living Index, a respected benchmark published by the Council for Community and Economic Research (C2ER) that provides a thorough overview of living expenses across different regions.
Rent data is provided by CoStar Group’s Market Trend reports. As the industry leader in commercial real estate information, analytics, and news, CoStar conducts extensive research to produce and maintain a comprehensive database of commercial real estate information. We combine this data with public record to provide the most up-to-date rental information available.
Consumer goods, services, and home prices are sourced from the Cost of Living Index published by the Council for Community and Economic Research (C2ER). The data on this page is updated quarterly. It was last published in June 2026.
Demographic information comes from Neustar and combines detailed address data with U.S. Census and American Community Survey statistics to produce reliable local estimates.


