7 Best Places to Live in Vermont
Open to exploring your options? Discover great cities in Vermont with our detailed guide.


Avg Rent
$2,056
Population
44,088
Renter Mix
62% Rent
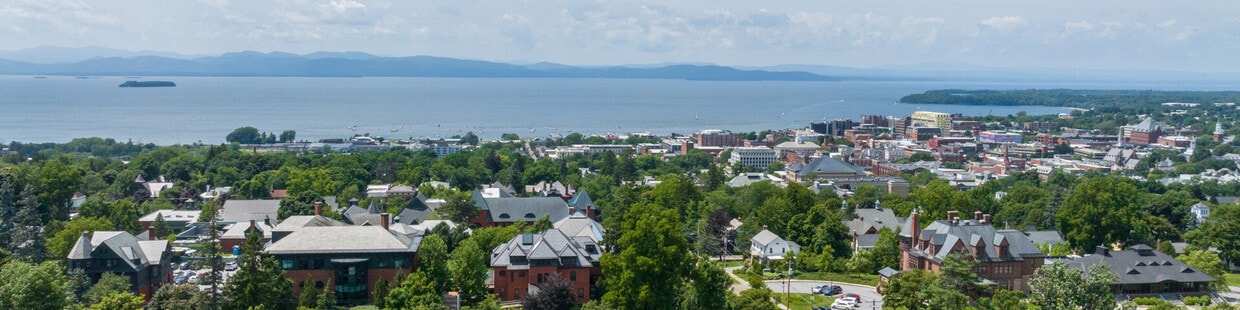
Burlington, Vermont combines small-city charm with natural beauty along the shores of Lake Champlain. The heart of downtown features Church Street Marketplace, a four-block pedestrian mall where local shops and restaurants create an inviting atmosphere throughout the year. The Burlington Bike Path traces the waterfront and connects to the Island Line Trail, extending into Lake Champlain on a historic railroad causeway. The rental market reflects strong demand, with current average rents ranging from $1,752 for studios to $2,068 for one-bedroom apartments, while larger units can command up to $3,417 for four bedrooms. The Hill Section stands out with its historic architecture and tree-lined streets near Champlain College, while the South End district features renovated industrial spaces housing galleries and studios.
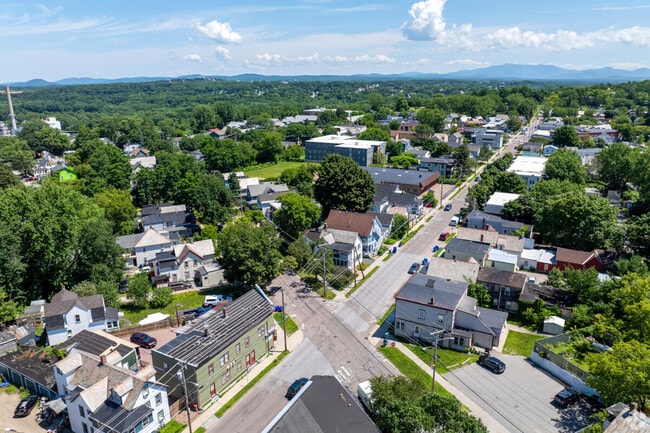
Burlington serves as home to the University of Vermont and the UVM Medical Center. The Old North End neighborhood preserves the city's cultural heritage, including the historic Little Jerusalem district. Residents enjoy access to waterfront paths, beaches, and parks, including the popular Waterfront Park and North Beach. The city demonstrates environmental leadership through its renewable energy initiatives, and the local food scene emphasizes connections to Vermont farms and producers. The original Ben & Jerry's scoop shop on Cherry Street marks the spot where the famous ice cream company began in 1978. From summer festivals at Waterfront Park to the year-round farmers' market in City Hall Park, Burlington offers recreational opportunities across all seasons.
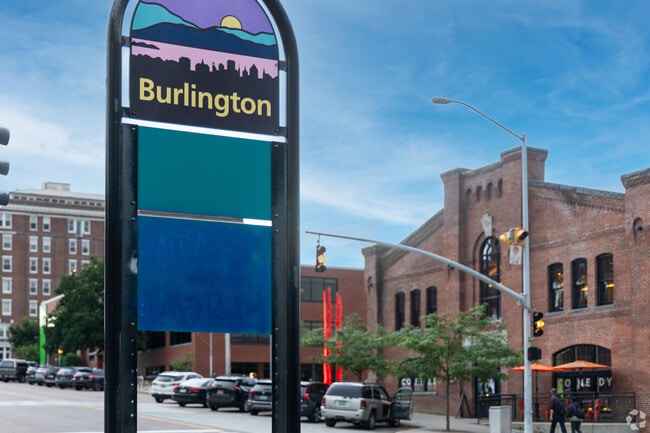
A "Burlington" sign on a sidewalk in Downtown Burlington.
An aerial view of the Old North End neighborhood in Burlington, VT.
Battery Park in Burlington is a 14 acre historic park offering stunning views of Lake Champlain.
Median Household Income
$65,563
Average: $91,803
Education
19,998
Residents Have a Degree
Job Market
23,988
Workers Employed
Median Age
30 Years
Largest Age Group
20-29 Years
Approximately 29% of Residents
Under 20
21%
Over 65
13%
Housing Distribution
Burlington has more renters than homeowners.

Education Distribution
Review this city's overall education levels.

As of July 2026, the average apartment rent in Burlington, VT is $1,663 for a studio, $2,056 for one bedroom, $1,719 for two bedrooms, and $1,480 for three bedrooms. Apartment rent in Burlington has decreased by -2.4% in the past year.
The cost of living in Burlington, VT is 13.4% higher than the national average. Generally, housing in Burlington is 28.9% more expensive than the national average, with rent falling between $1,480 - $2,056. You can expect to pay 4.1% more for groceries, 12.7% more for utilities, and 4.2% more for transportation.
Compare Cities

7 Best Places to Live in Vermont
Open to exploring your options? Discover great cities in Vermont with our detailed guide.

How Long Can a Visitor Stay in My Apartment?
Know when a guest crosses the line and the couch-surfer legally becomes a tenant.

11 Tips for First Time Renters
Find an apartment that's the perfect fit and make it feel like home with these first-time renter tips.
Explore how walkable, bikeable, drivable, and transit-friendly Burlington, VT is for everyday living.
Fairly Walkable
Walkability
Minimal Public Transit
Transit
Exceptionally Drivable
Drivability
Not Bikeable
Bikeability
Public
Grades PK-5
559 Students

Public
Grades PK-5
279 Students

Sustainability Academy At Lawrence Barnes
Public
Grades PK-5
213 Students
Public
Grades PK-5
255 Students

Integrated Arts Academy At H. O. Wheeler
Public
Grades PK-5
201 Students
Public
Grades 6-8
356 Students
Public
Grades 6-8
322 Students
Public
Grades 9-12
987 Students
Public
Grades 9-12

† Our analysis of utilities, groceries, transportation, healthcare, home prices, and other goods and services is sourced from the Cost of Living Index, a respected benchmark published by the Council for Community and Economic Research (C2ER) that provides a thorough overview of living expenses across different regions.
Rent data is provided by CoStar Group’s Market Trend reports. As the industry leader in commercial real estate information, analytics, and news, CoStar conducts extensive research to produce and maintain a comprehensive database of commercial real estate information. We combine this data with public record to provide the most up-to-date rental information available.
Consumer goods, services, and home prices are sourced from the Cost of Living Index published by the Council for Community and Economic Research (C2ER). The data on this page is updated quarterly. It was last published in June 2026.
Demographic information comes from Neustar and combines detailed address data with U.S. Census and American Community Survey statistics to produce reliable local estimates.


