Median Age
40 Years
Largest Age Group
10-19 Years
Approximately 14% of Residents
Under 20
26%
Over 65
18%

Avg Rent
$1,135
Population
17,356
Renter Mix
26% Rent
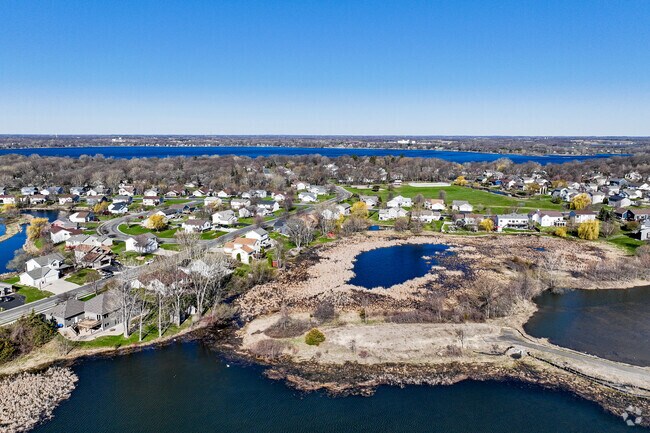
Buffalo is the county seat of Wright County and one of the Minneapolis-Saint Paul metro area's most appealing smaller cities, sitting about 42 miles northwest of downtown Minneapolis. The community has grown steadily over the years, drawing people who want breathing room without losing easy access to a major metro. The Downtown district along Buffalo Lake anchors the city's identity with a lively arts scene, home to the Buffalo Community Theater and Buffalo Community Orchestra, two long-standing cultural institutions that give the city a personality all its own.
Residential life here spreads across distinct pockets, from the lakeshore neighborhoods surrounding Buffalo Lake, Lake Pulaski, and Mary Lake to quieter subdivisions further from the city center. The housing mix reflects that range, with traditional single-family rentals, townhomes, and apartment communities offering everything from cozy one-bedroom layouts to spacious multi-bedroom floor plans. Newer apartment communities tend to feature contemporary finishes, while older residential pockets carry a more classic Midwestern architectural character.
Buffalo has served as the Wright County seat since the city was platted in 1856, giving it a civic importance that shapes daily life even today. That deep-rooted history, combined with steady population growth and proximity to Minneapolis, makes Buffalo a city worth serious consideration for anyone exploring Minnesota rental options.
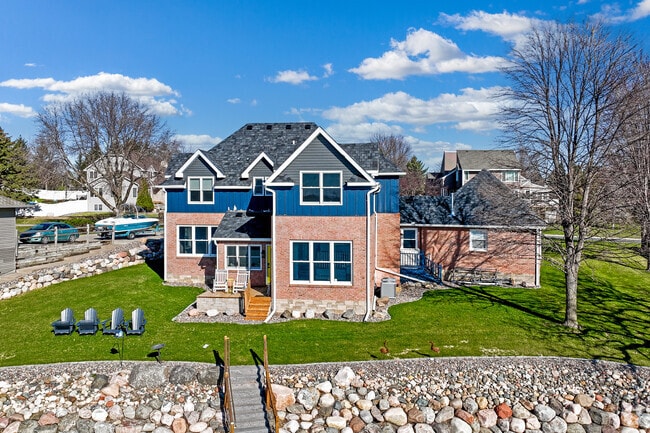
An elegant craftsman-style home with upscale landscaping sits on the shores of Lake Pulaski.
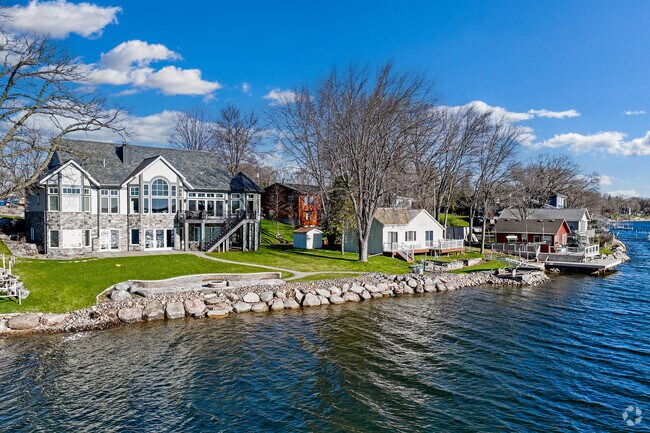
Upscale homes with dock access line Lake Pulaski.
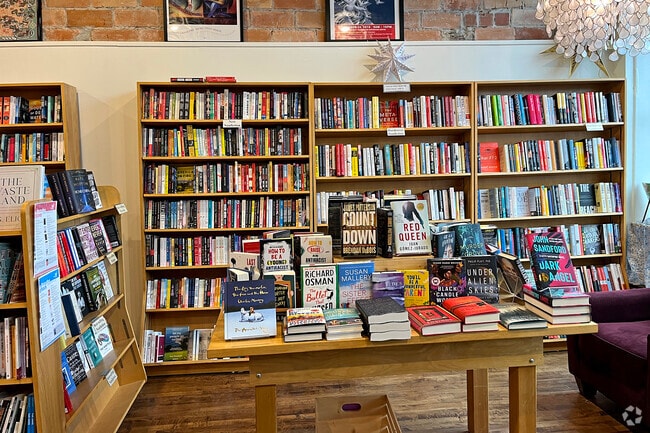
Buffalo Books & Coffee is a local favorite for hand-selected books and a cozy atmosphere.
Historic brick buildings with quaint shops and cafes line streets in downtown Buffalo.
Cozy up to the bar at Hayes' Public House in downtown Buffalo.
Buffalo Heights Golf Course offers nine holes of golf, a practice course, and a restaurant.
Median Household Income
$86,354
Average: $100,527
Education
3,886
Residents Have a Degree
Job Market
8,993
Workers Employed
Median Age
40 Years
Largest Age Group
10-19 Years
Approximately 14% of Residents
Under 20
26%
Over 65
18%
Housing Distribution
Buffalo has more homeowners than renters.

Education Distribution
Review this city's overall education levels.

As of July 2026, the average apartment rent in Buffalo, MN is $1,064 for a studio, $1,135 for one bedroom, $1,324 for two bedrooms, and $1,521 for three bedrooms. Apartment rent in Buffalo has increased by 3.0% in the past year.
Explore how walkable, bikeable, drivable, and transit-friendly Buffalo, MN is for everyday living.
Fairly Walkable
Walkability
Exceptionally Drivable
Drivability
Fairly Bikeable
Bikeability
Public
Grades K-5
437 Students

Public
Grades K-5
437 Students
Public
Grades K-5
224 Students

Public
Grades PK-5
348 Students

Public
Grades K-5
452 Students

Buffalo Community Middle School
Public
Grades 6-8
1,160 Students
Public
Grades 6-8
1,142 Students
Public
Grades 6-12
23 Students

Public
Grades K-8
8 Students
Public
Grades K-12
Public
Grades 9-12
1,818 Students

Public
Grades 9-12
1,818 Students
Public
Grades 9-12
33 Students
Public
Grades 6-12
23 Students
Public
Grades 9-12
† Our analysis of utilities, groceries, transportation, healthcare, home prices, and other goods and services is sourced from the Cost of Living Index, a respected benchmark published by the Council for Community and Economic Research (C2ER) that provides a thorough overview of living expenses across different regions.
Rent data is provided by CoStar Group’s Market Trend reports. As the industry leader in commercial real estate information, analytics, and news, CoStar conducts extensive research to produce and maintain a comprehensive database of commercial real estate information. We combine this data with public record to provide the most up-to-date rental information available.
Consumer goods, services, and home prices are sourced from the Cost of Living Index published by the Council for Community and Economic Research (C2ER). The data on this page is updated quarterly. It was last published in June 2026.
Demographic information comes from Neustar and combines detailed address data with U.S. Census and American Community Survey statistics to produce reliable local estimates.


