
Preserve at Riverwalk Apartments
360 11th St E,
Bradenton, FL 34208
$1,445 - $3,099
1-3 Beds
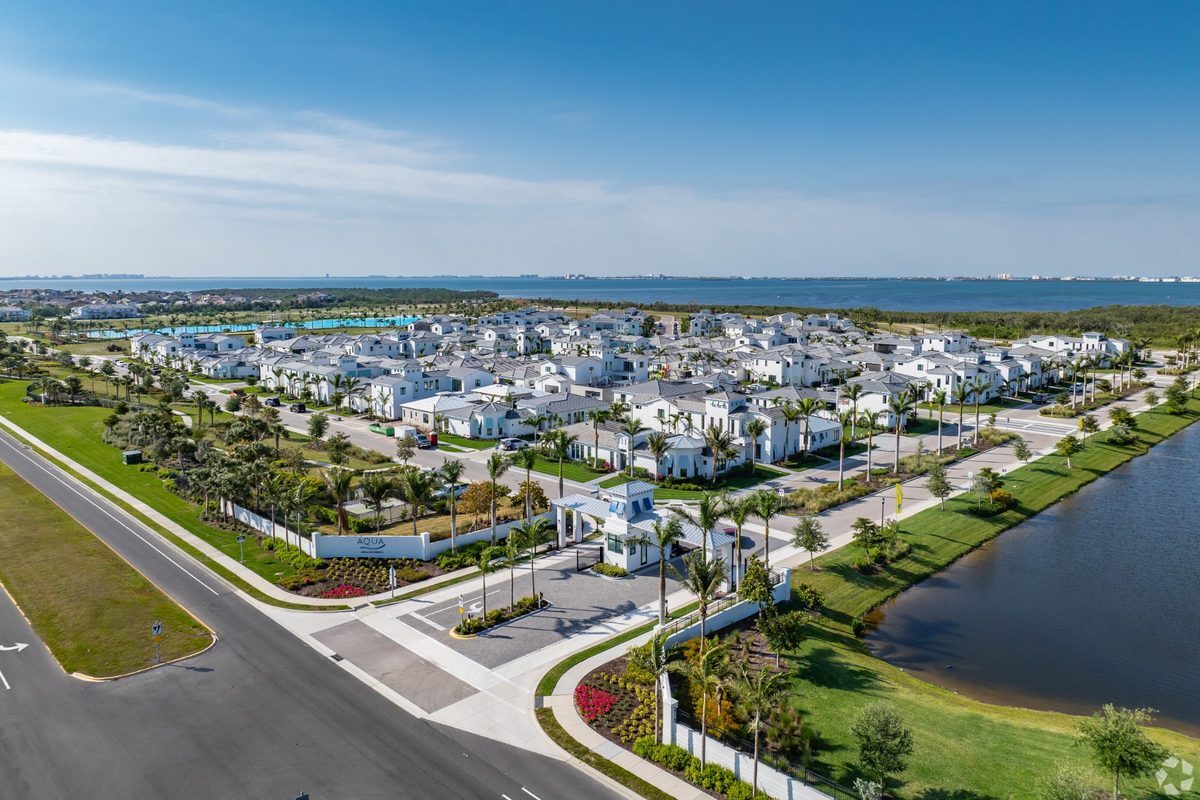
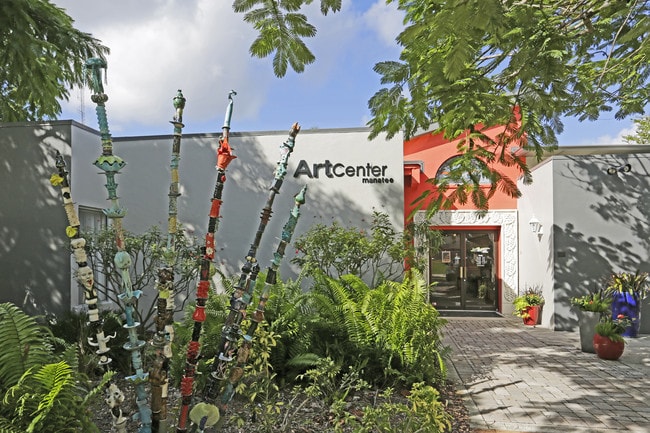
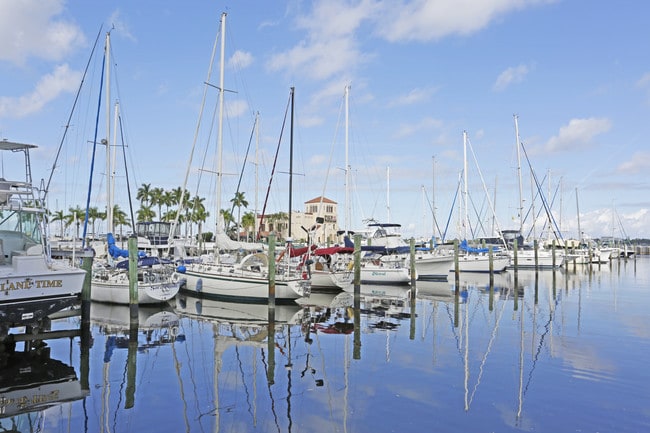
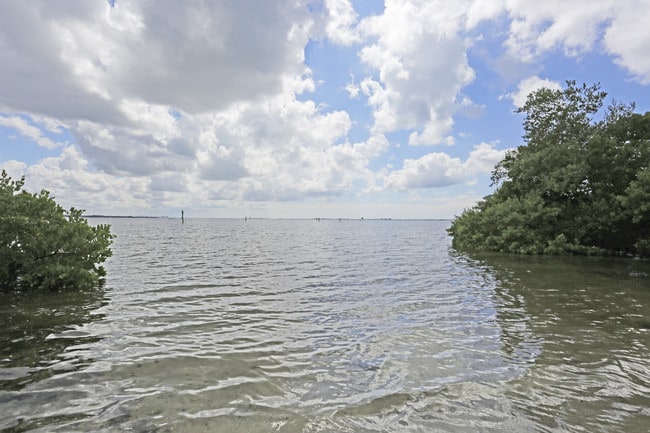
Situated along Florida's Gulf Coast, Bradenton combines coastal living with a strong sense of community. The 1.5-mile Bradenton Riverwalk serves as the heart of the city, offering a waterfront park along the Manatee River where residents gather for events and recreation. Current rental trends show one-bedroom apartments averaging $1,656, with prices showing a slight decrease of 0.55% over the past year. Housing options span across several neighborhoods, including the distinctive Village of the Arts district, where restored bungalows showcase local artists and galleries.
Bradenton residents enjoy both cultural attractions and outdoor recreation. The Bishop Museum of Science and Nature anchors the downtown area, while nearby Anna Maria Island provides access to Gulf Coast beaches. Baseball fans can catch spring training games at LECOM Park, home to the Pittsburgh Pirates, and outdoor enthusiasts often explore the De Soto National Memorial. The downtown district hosts regular community events, while neighborhoods like Point Pleasant and Ballard Park offer waterfront views. The city's economy includes major employers like Tropicana Products, which operates production facilities locally.
As of March 2026, the average apartment rent in Bradenton, FL is $1,281 for a studio, $1,529 for one bedroom, $1,775 for two bedrooms, and $2,201 for three bedrooms. Apartment rent in Bradenton has decreased by -7.5% in the past year.
The cost of living in Bradenton, FL is 2.5% lower than the national average. Generally, housing in Bradenton is 0.1% less expensive than the national average, with rent falling between $1,281 - $2,201. You can expect to pay 1.2% more for groceries, 10.9% less for utilities, and 1.5% more for transportation.
Explore how walkable, bikeable, drivable, and transit-friendly Bradenton, FL is for everyday living.
Car-Dependent
This area is considered a car-dependent area and most errands will require a car.
Minimal Transit
You'll likely want a car when living in this area since it has few transit options.
Somewhat Bikeable
You might be able to find places to ride your bike in this area, but you’ll most likely want your car for most errands.
Ida M. Stewart Elementary School
Public
Grades PK-5

Public
Grades PK-5

B.D. Gullett Elementary School
Public
Grades PK-5
Louise R Johnson K-8 School of International Studies
Public
Grades PK-8

Braden River Elementary School
Public
Grades PK-5
State College Of Florida Collegiate School
Public
Grades 6-12

Public
Grades 6-8
Public
Grades 6-8
Louise R Johnson K-8 School of International Studies
Public
Grades PK-8
Public
Grades 6-8
State College Of Florida Collegiate School
Public
Grades 6-12
Public
Grades PK & 9-12

Public
Grades 9-12

Public
Grades 9-12

Team Success A School Of Excellence
Public
Grades K-12

70
Communities
23,308
Units
28
Cities

295
Communities
78,523
Units
169
Cities

237
Communities
58,795
Units
124
Cities

138
Communities
25,621
Units
63
Cities

82
Communities
24,998
Units
45
Cities
58
Communities
14,173
Units
40
Cities
† Our analysis of utilities, groceries, transportation, healthcare, home prices, and other goods and services is sourced from the Cost of Living Index, a respected benchmark published by the Council for Community and Economic Research (C2ER) that provides a thorough overview of living expenses across different regions.
Rent data is provided by CoStar Group’s Market Trend reports. As the industry leader in commercial real estate information, analytics, and news, CoStar conducts extensive research to produce and maintain a comprehensive database of commercial real estate information. We combine this data with public record to provide the most up-to-date rental information available.
Consumer goods, services, and home prices are sourced from the Cost of Living Index published by the Council for Community and Economic Research (C2ER). The data on this page is updated quarterly. It was last published in February 2026.


