
Barrow
10235 Cedar Crossing St,
Baytown, TX 77521
$1,395 - $2,726 Total Monthly Price
1-3 Beds


![[011]- Baytown Nature Preserve-](https://images1.apartments.com/i2/9bFAtO-bHpyx9FEFQTPn6m35HV8UOFBGCYbEv5-fUFo/117/baytown-tx-011--baytown-nature-preserve-.jpg)
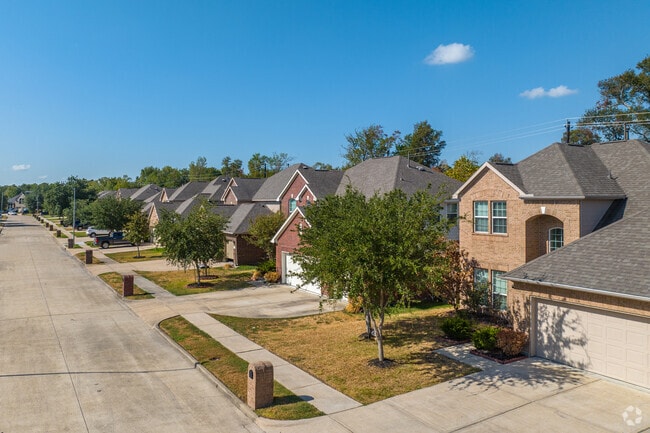

Located along the Houston Ship Channel, Baytown combines coastal living with industrial heritage. This city of over 83,000 people offers waterfront living and affordable housing options, with current average rents ranging from $719 for studios to $1,392 for three-bedroom homes. The rental market has remained relatively stable, with most unit types seeing modest year-over-year changes of less than 2%. Residents find appealing neighborhoods throughout the city's 37 square miles, particularly near the Baytown Nature Center, a 450-acre peninsula wildlife sanctuary surrounded by three bays.
Baytown's Downtown Arts District anchors the cultural scene, featuring the Baytown Little Theater and Lee College Performing Arts Center. The Fred Hartman Bridge stands as a local landmark, while the Baytown Nature Center offers hiking trails and wildlife viewing areas. The city's industrial story began in 1919 when Humble Oil (now ExxonMobil) established its refinery complex, transforming three separate towns into today's unified city. Residents enjoy access to numerous parks, including Jenkins Park and Roseland Park, while maintaining connections to both the area's industrial roots and natural landscapes.
[011]- Baytown Nature Preserve-
Lynchburg is a place where Texas hospitality meets modern living.
Lynchburg's outdoor enthusiasts enjoy fishing, boating, and beachcombing.
Texas pride runs deep in the Lone Star State, as shown on this mural in Lynchburg.
An art piece of two children playing baseball pays homage to Baytown's Little League.
Evergreen Fairways is located on the banks of Trinity Bay, offering many fishing opprtunities.
As of March 2026, the average apartment rent in Baytown, TX is $741 for a studio, $1,026 for one bedroom, $1,241 for two bedrooms, and $1,448 for three bedrooms. Apartment rent in Baytown has decreased by -0.4% in the past year.
Explore how walkable, bikeable, drivable, and transit-friendly Baytown, TX is for everyday living.
Car-Dependent
This area is considered a car-dependent area and most errands will require a car.
Minimal Transit
You'll likely want a car when living in this area since it has few transit options.
Somewhat Bikeable
You might be able to find places to ride your bike in this area, but you’ll most likely want your car for most errands.
Public
Grades PK-5
788 Students

Victoria Walker Elementary School
Public
Grades PK-5
829 Students

Stephen F Austin Elementary School
Public
Grades PK-5
813 Students
Public
Grades PK-5
657 Students
Public
Grades K-5
628 Students
Public
Grades 6-8
997 Students
Cedar Bayou Junior High School
Public
Grades 6-8
969 Students
Public
Grades 6-8
743 Students
Horace Mann Junior High School
Public
Grades 6-8
811 Students

Impact Early College High School
Public
Grades 9-12
416 Students
Public
Grades 9-12
2,223 Students

Public
Grades 9-12
2,098 Students
Public
Grades 9-12
1,845 Students

3,487
Communities
959,069
Units
894
Cities

19
Communities
2,787
Units
11
Cities

91
Communities
17,658
Units
44
Cities

28
Communities
7,258
Units
14
Cities

624
Communities
174,107
Units
247
Cities

347
Communities
103,303
Units
139
Cities
† Our analysis of utilities, groceries, transportation, healthcare, home prices, and other goods and services is sourced from the Cost of Living Index, a respected benchmark published by the Council for Community and Economic Research (C2ER) that provides a thorough overview of living expenses across different regions.
Rent data is provided by CoStar Group’s Market Trend reports. As the industry leader in commercial real estate information, analytics, and news, CoStar conducts extensive research to produce and maintain a comprehensive database of commercial real estate information. We combine this data with public record to provide the most up-to-date rental information available.
Consumer goods, services, and home prices are sourced from the Cost of Living Index published by the Council for Community and Economic Research (C2ER). The data on this page is updated quarterly. It was last published in February 2026.


