Median Age
41 Years
Largest Age Group
35-44 Years
Approximately 14% of Residents
Under 20
25%
Over 65
19%

Avg Rent
$1,098
Population
2,333
Renter Mix
35% Rent
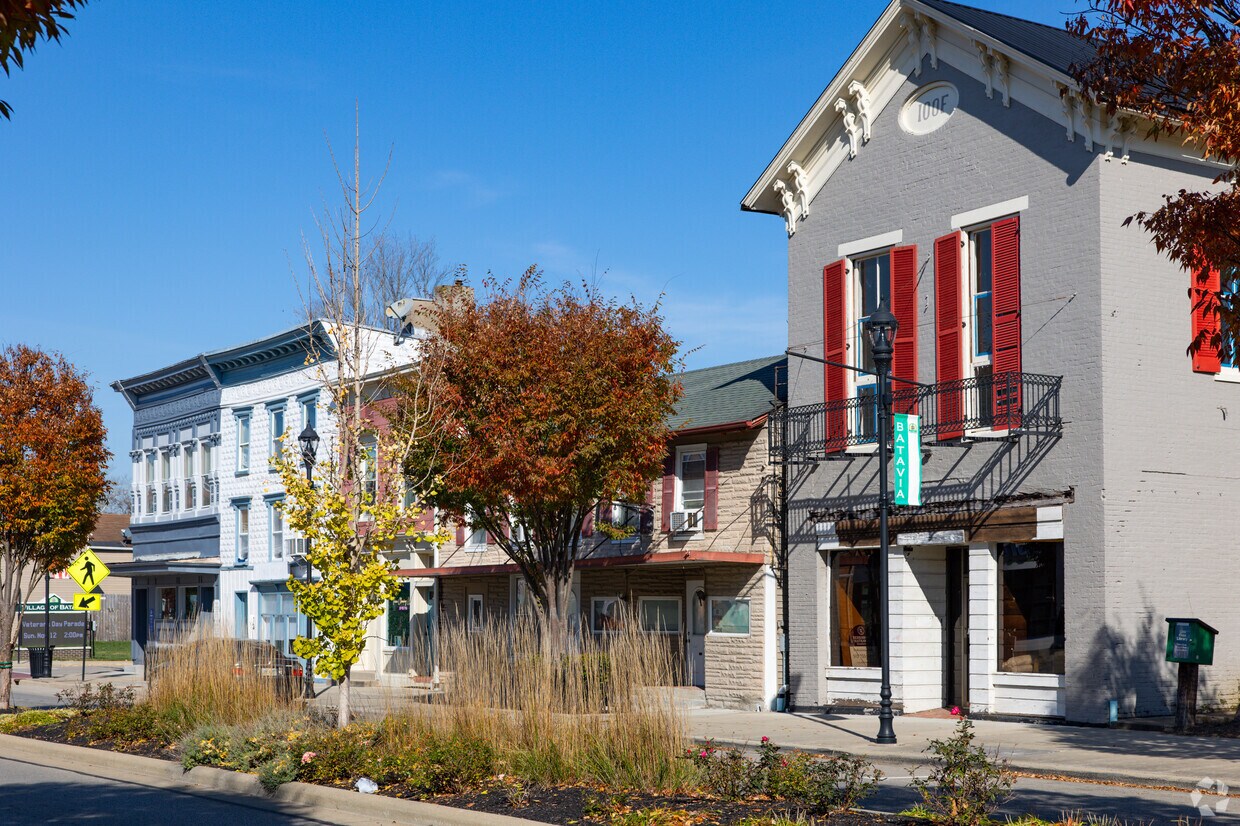
Batavia, Ohio sits at the heart of Clermont County as its county seat, offering a small-town atmosphere with surprisingly easy access to a major metro area. Located about 25 miles east of downtown Cincinnati, this village of roughly 2,300 residents strikes a balance between quiet, close-knit living and the economic opportunities of a larger city nearby. Batavia's roots run deep: it was platted in 1814 and served as a stop on the Norfolk and Western Railway for nearly a century, giving the area a sense of history that still shows in its walkable core.
Day-to-day life here moves at a relaxed pace. The surrounding Clermont County landscape includes ample green space, and East Fork State Park sits just a short drive away. The town's identity leans toward a commuter-friendly suburb, drawing residents who want breathing room without being far from Cincinnati's employment hubs, healthcare, and entertainment options. Clermont College, a branch campus of the University of Cincinnati, anchors an educational presence locally.
The housing mix in Batavia leans toward traditional single-family homes and modest apartment communities, with options ranging from garden-style rentals to townhome-style units. The rental market here tends to be more accessible than what you'd find closer to Cincinnati's urban core, making it an appealing option for those prioritizing space and affordability.
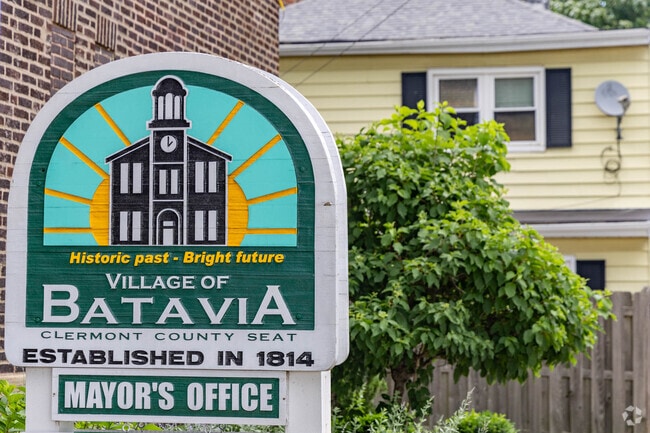
Batavia is located in Clermont County and has an engaging community.
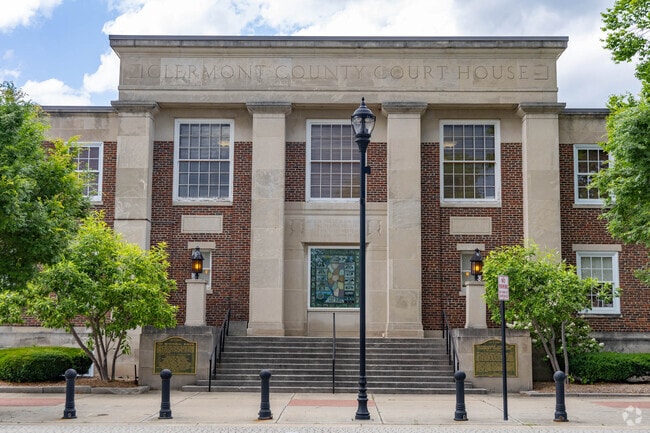
The Clermont County Courthouse is a grand historic building in Batavia.
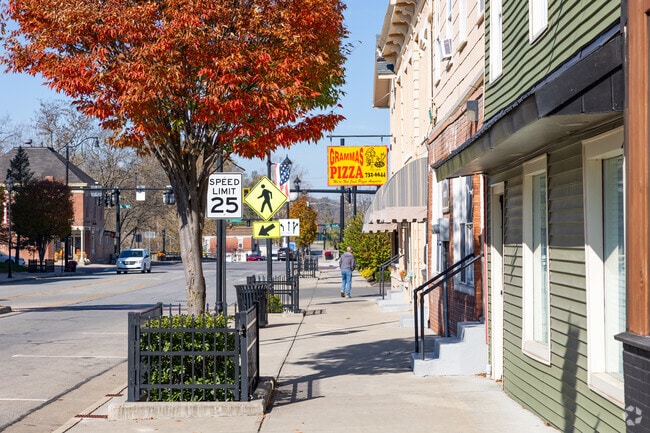
Walk through the town center of the Batavia neighborhood.
Batavia offers residents a small-town rural feel with an uptown historic district.
Batavia is a truly nice place to live if you are looking to find your new destination.
Batavia's historic district features mom-and-pop retail shops and restaurants.
Median Household Income
$66,179
Average: $81,283
Education
420
Residents Have a Degree
Job Market
1,093
Workers Employed
Median Age
41 Years
Largest Age Group
35-44 Years
Approximately 14% of Residents
Under 20
25%
Over 65
19%
Housing Distribution
Batavia has more homeowners than renters.

Education Distribution
Review this city's overall education levels.

As of July 2026, the average apartment rent in Batavia, OH is $945 for a studio, $1,099 for one bedroom, $1,523 for two bedrooms, and $1,758 for three bedrooms. Apartment rent in Batavia has decreased by -1.8% in the past year.
Explore how walkable, bikeable, drivable, and transit-friendly Batavia, OH is for everyday living.
Somewhat Walkable
Walkability
Exceptionally Drivable
Drivability
Somewhat Bikeable
Bikeability
Public
Grades PK-5
1,241 Students

Public
Grades PK-5
622 Students

Clermont Northeastern Elementary School
Public
Grades K-5
497 Students
Public
Grades 6-8
559 Students
Public
Grades 6-8
1,695 Students

Clermont Northeastern Middle School
Public
Grades 6-8
298 Students

Public
Grades 9-12
619 Students
Public
Grades 9-12
1,958 Students
Clermont Northeastern High School
Public
Grades 9-12
374 Students

Public
Grades 9-12
1,187 Students
† Our analysis of utilities, groceries, transportation, healthcare, home prices, and other goods and services is sourced from the Cost of Living Index, a respected benchmark published by the Council for Community and Economic Research (C2ER) that provides a thorough overview of living expenses across different regions.
Rent data is provided by CoStar Group’s Market Trend reports. As the industry leader in commercial real estate information, analytics, and news, CoStar conducts extensive research to produce and maintain a comprehensive database of commercial real estate information. We combine this data with public record to provide the most up-to-date rental information available.
Consumer goods, services, and home prices are sourced from the Cost of Living Index published by the Council for Community and Economic Research (C2ER). The data on this page is updated quarterly. It was last published in June 2026.
Demographic information comes from Neustar and combines detailed address data with U.S. Census and American Community Survey statistics to produce reliable local estimates.


