Median Age
38 Years
Largest Age Group
35-44 Years
Approximately 14% of Residents
Under 20
26%
Over 65
16%


Avg Rent
$1,763
Population
21,184
Renter Mix
38% Rent
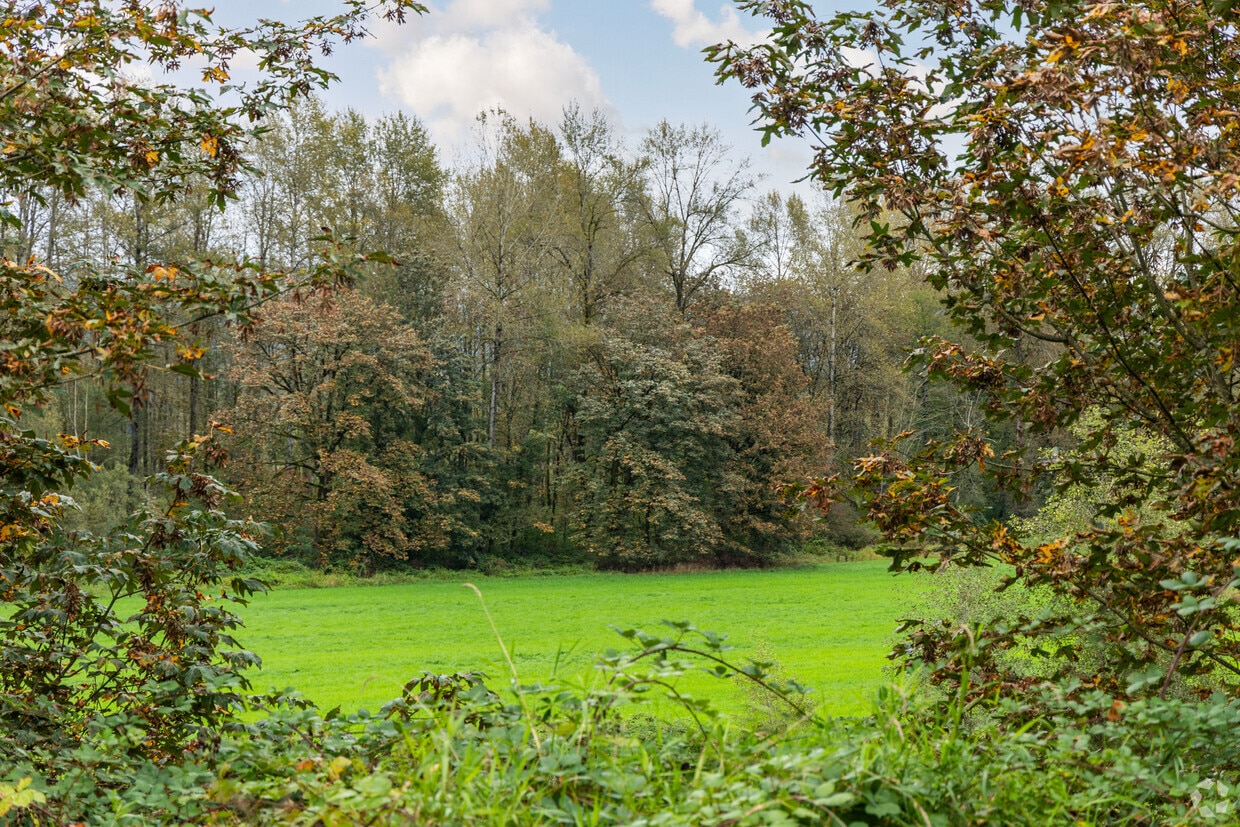
Arlington, Washington, is a small but growing city in Snohomish County, where the Cascade foothills shape the skyline and the pace of life feels intentionally unhurried compared to the metro bustle of Seattle to the south. The city covers roughly 10 square miles and has built a reputation as a place where an outdoor-oriented lifestyle and community-scaled living go hand in hand. Boeing's manufacturing presence in nearby Everett anchors much of the regional economy, and Arlington's own industrial and commercial corridors continue to attract employers looking for space outside crowded urban centers.
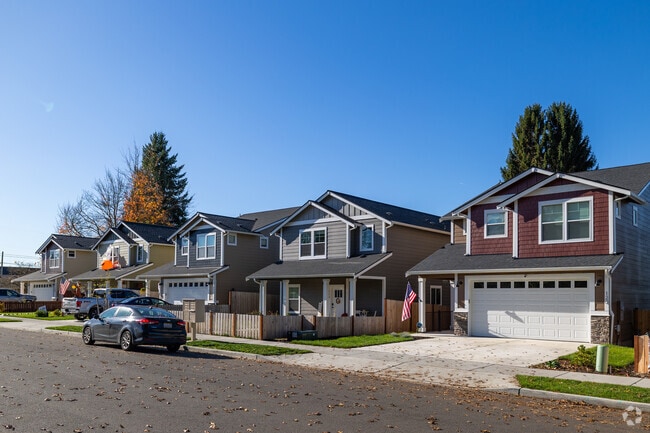
Neighborhoods here shift from a walkable historic downtown core to quieter residential streets on the city's edges, offering a range of settings for renters. The housing mix reflects that variety, with apartment communities ranging from compact studios in older, character-rich buildings to newer two- and three-bedroom units in garden-style developments and townhome-style rentals. High-rise living is not part of the picture here, which gives Arlington a distinctly grounded, small-city feel that sets it apart from the denser corridor cities along I-5.
Arlington is home to the Arlington Municipal Airport, one of the busiest general aviation airports in Washington State, and it hosts the annual Arlington Fly-In, drawing aviation enthusiasts from across the Pacific Northwest each summer. That event speaks to something real about this city: it takes pride in what makes it distinct, and that spirit shows in the community it has built.
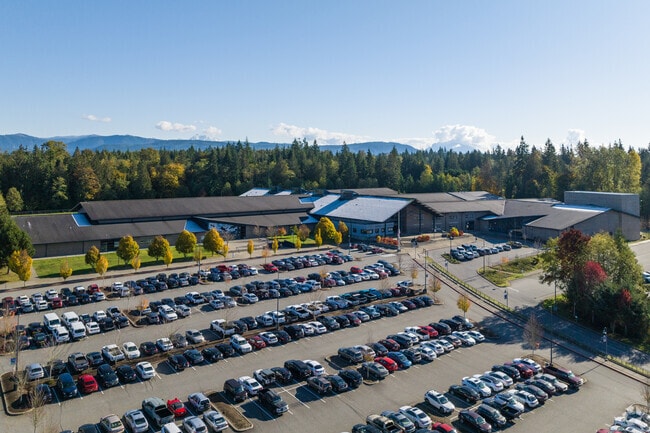
Arlington High School is rated a B+ overall by Niche.
Walker's Coffee offers a quick, tasty cup of caffeine for Smokey Point residents.
Arlington residents head to Music in the Park at Legion Memorial Park for summer time fun.
Cast out a line on the Stillaguamish River in Arlington Heights.
Arlington Heights has beautiful traditional homes with large, equestrian-style plots.
The Stilly Diner near Arlington Heights is a local hotspot for American diner cuisine.
Median Household Income
$92,429
Average: $108,486
Education
4,394
Residents Have a Degree
Job Market
11,218
Workers Employed
Median Age
38 Years
Largest Age Group
35-44 Years
Approximately 14% of Residents
Under 20
26%
Over 65
16%
Housing Distribution
Arlington has more homeowners than renters.

Education Distribution
Review this city's overall education levels.

As of August 2026, the average apartment rent in Arlington, WA is $1,528 for a studio, $1,776 for one bedroom, $2,086 for two bedrooms, and $2,279 for three bedrooms. Apartment rent in Arlington has increased by 2.4% in the past year.
Explore how walkable, bikeable, drivable, and transit-friendly Arlington, WA is for everyday living.
Somewhat Walkable
Walkability
Very Drivable
Drivability
Fairly Bikeable
Bikeability
Public
Grades K-5
593 Students

Public
Grades PK-5
530 Students
Public
Grades K-5
660 Students

Public
Grades K-5
493 Students

Cougar Creek Elementary School
Public
Grades K-5
359 Students
Public
Grades 6-8
567 Students
Public
Grades 6-8
669 Students
Public
Grades PK-12

Public
Grades 9-12
1,661 Students

Public
Grades 9-12
100 Students
Public
Grades 9-12
850 Students

Public
Grades 9-12
82 Students
Public
Grades PK-12
† Our analysis of utilities, groceries, transportation, healthcare, home prices, and other goods and services is sourced from the Cost of Living Index, a respected benchmark published by the Council for Community and Economic Research (C2ER) that provides a thorough overview of living expenses across different regions.
Rent data is provided by CoStar Group’s Market Trend reports. As the industry leader in commercial real estate information, analytics, and news, CoStar conducts extensive research to produce and maintain a comprehensive database of commercial real estate information. We combine this data with public record to provide the most up-to-date rental information available.
Consumer goods, services, and home prices are sourced from the Cost of Living Index published by the Council for Community and Economic Research (C2ER). The data on this page is updated quarterly. It was last published in June 2026.
Demographic information comes from Neustar and combines detailed address data with U.S. Census and American Community Survey statistics to produce reliable local estimates.


