Median Age
35 Years
Largest Age Group
20-29 Years
Approximately 16% of Residents
Under 20
27%
Over 65
14%


Area Guide
Avg Rent
$1,134
Population
404,607
Renter Mix
47% Rent
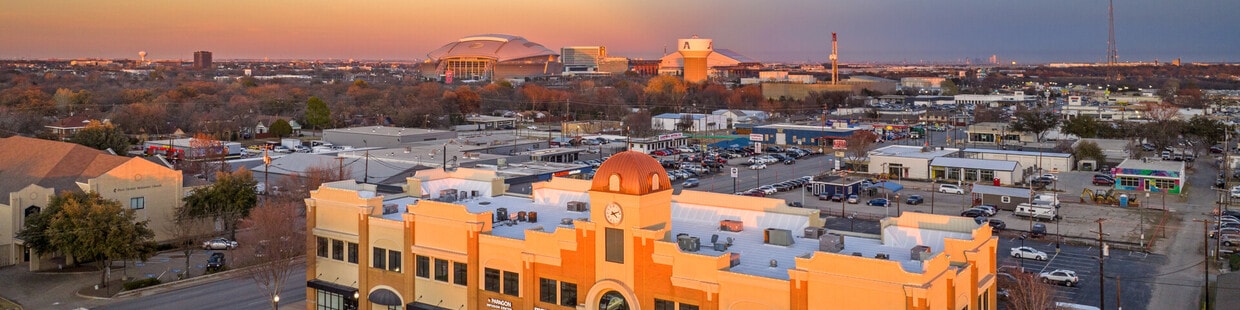
Sandwiched between Fort Worth and Dallas, Arlington is part of the massive DFW Metroplex. This big (even by Texas standards), busy, thriving city is home to some powerhouse locations, including the University of Texas at Arlington, AT&T Stadium (home of the Dallas Cowboys), Globe Life Park (home of the Texas Rangers), Six Flags Over Texas, and Hurricane Harbor. These, along with Texas Health Resources, General Motors Arlington Assembly, and GM Financial, are some of the city's largest employers.
With so much happening in and around this active, dynamic metropolis, you'll never sit around your Arlington apartment wondering what to do. Head to the Arlington Museum of Art or the International Bowling Museum, visit the Village Creek Historical Area or SW Nature Preserve, go hiking at River Legacy Parks, see the animals at the Fort Worth Zoo, and go shopping at Grand Prairie Premium Outlets or the Parks at Arlington. From students to sports fans to foodies to families, there's something for everyone in the "American Dream City."
Enjoy a meal or a drink at the Arlington Backyard.
AT&T Football Stadium is home to the Dallas Cowboys.
The Globe Life Field in Arlington fills with Texas Rangers fans on baseball game days.
Six Flags is perfect for thrill seekers.
Median Household Income
$64,556
Average: $86,833
Education
106,975
Residents Have a Degree
Job Market
214,115
Workers Employed
Median Age
35 Years
Largest Age Group
20-29 Years
Approximately 16% of Residents
Under 20
27%
Over 65
14%
Housing Distribution
Arlington has more homeowners than renters.

Education Distribution
Review this city's overall education levels.

As of July 2026, the average apartment rent in Arlington, TX is $1,014 for a studio, $1,135 for one bedroom, $1,536 for two bedrooms, and $2,127 for three bedrooms. Apartment rent in Arlington has decreased by -2.4% in the past year.
The cost of living in Arlington, TX is 2.1% lower than the national average. Generally, housing in Arlington is 7.4% less expensive than the national average, with rent falling between $1,014 - $2,127. You can expect to pay 1.2% less for groceries, 12.2% more for utilities, and 9.7% less for transportation.
Compare Cities
Explore how walkable, bikeable, drivable, and transit-friendly Arlington, TX is for everyday living.
Moderately Walkable
Walkability
Very Drivable
Drivability
Fairly Bikeable
Bikeability
Public
Grades PK-5
712 Students

NEWMAN INTERNATIONAL ACADEMY MANSFIELD EAST
Public
Grades PK-12
140 Students
Public
Grades PK-5
436 Students

Public
Grades PK-5
933 Students

Public
Grades PK-5
726 Students
NEWMAN INTERNATIONAL ACADEMY MANSFIELD EAST
Public
Grades PK-12
140 Students
Arlington Classics Academy - Middle
Public
Grades 6-8
482 Students
Public
Grades 6-8
876 Students

Public
Grades 6-8
854 Students
Public
Grades 6-8
819 Students
Arlington Collegiate High School
Public
Grades 9-12
403 Students
TCCSE Early College High School At Timberview
Public
Grades 9-12
240 Students
NEWMAN INTERNATIONAL ACADEMY MANSFIELD EAST
Public
Grades PK-12
140 Students
Public
Grades 9-12
3,789 Students

Mansfield Timberview High School
Public
Grades 9-12
1,864 Students
† Our analysis of utilities, groceries, transportation, healthcare, home prices, and other goods and services is sourced from the Cost of Living Index, a respected benchmark published by the Council for Community and Economic Research (C2ER) that provides a thorough overview of living expenses across different regions.
Rent data is provided by CoStar Group’s Market Trend reports. As the industry leader in commercial real estate information, analytics, and news, CoStar conducts extensive research to produce and maintain a comprehensive database of commercial real estate information. We combine this data with public record to provide the most up-to-date rental information available.
Consumer goods, services, and home prices are sourced from the Cost of Living Index published by the Council for Community and Economic Research (C2ER). The data on this page is updated quarterly. It was last published in June 2026.
Demographic information comes from Neustar and combines detailed address data with U.S. Census and American Community Survey statistics to produce reliable local estimates.


