Median Age
38 Years
Largest Age Group
10-19 Years
Approximately 14% of Residents
Under 20
27%
Over 65
20%
Avg Rent
$735
Population
75,901
Renter Mix
30% Rent
A large suburbia among the desert and mountainous terrain in California, Apple Valley is a scenic oasis with natural beauty, affordable residential areas, and a diverse community. Apple Valley has a longstanding history that led it to be the suburban oasis that it is today.
Community events such as yoga classes, sports teams, music lessons, holiday festivals, live concerts, kid-friendly activities and more take place in Apple Valley. Visit the Victor Valley Museum to learn more about the High Desert, or enjoy the conveniences in town, such as the local movie theater, restaurants, and popular retailers. There are a multitude of affordable apartment and condo rentals available in the diverse, scenic town of Apple Valley!
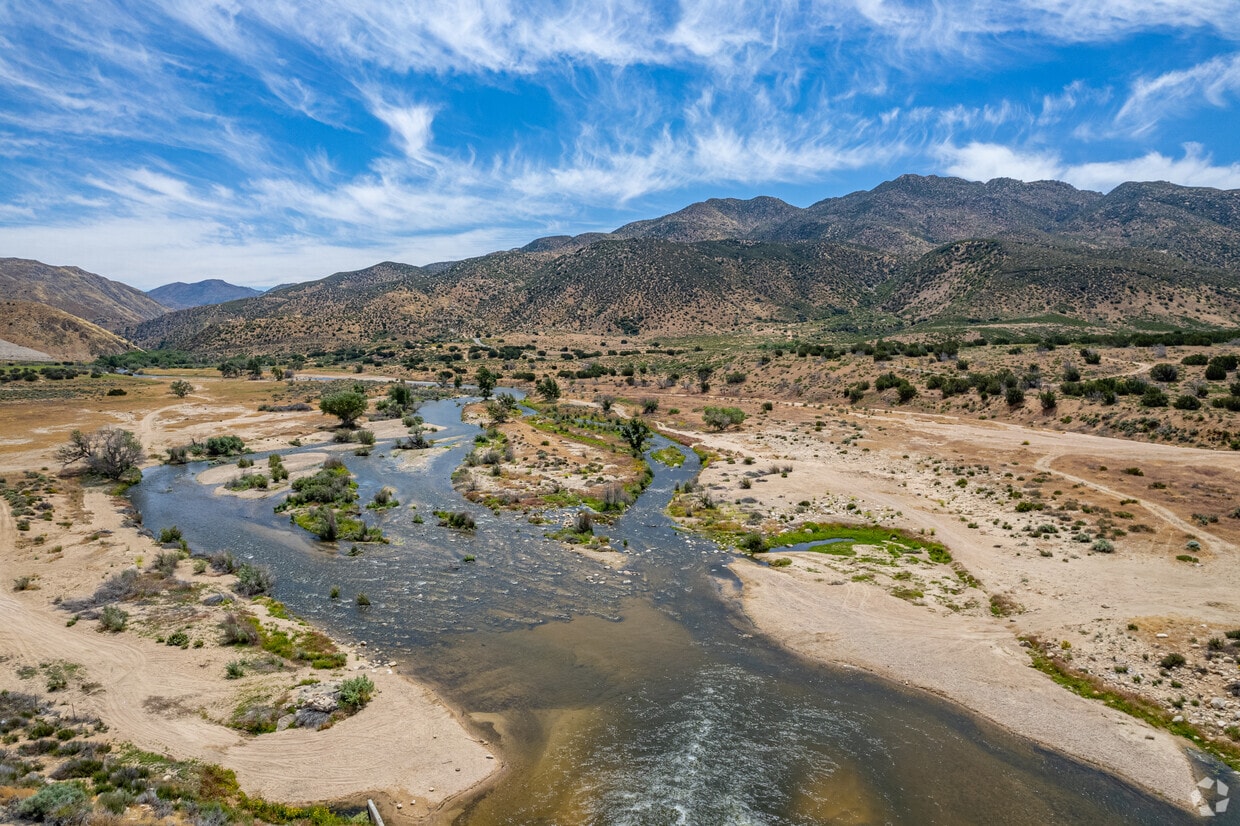
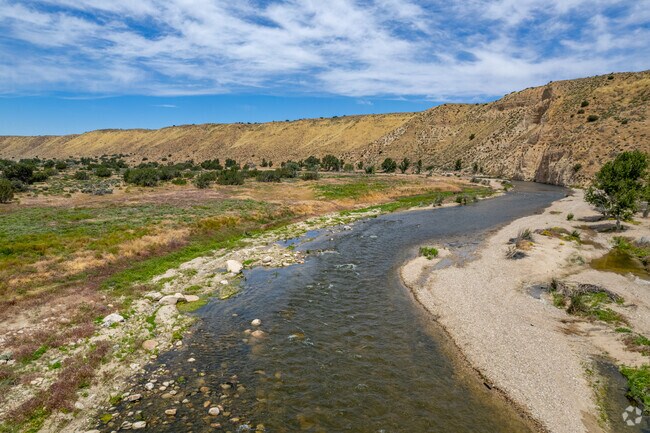
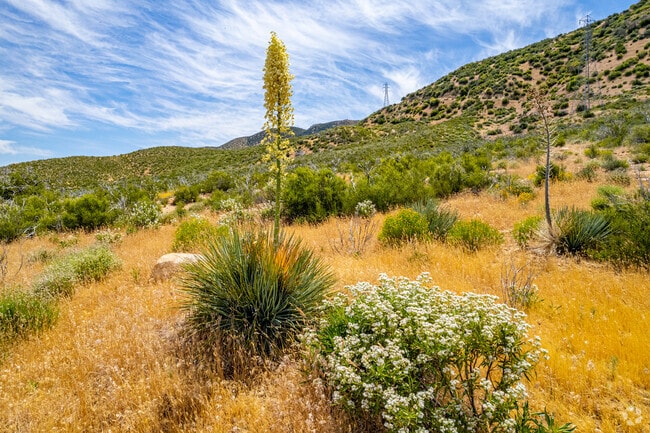
Apple Valley has amazing desert scenery.
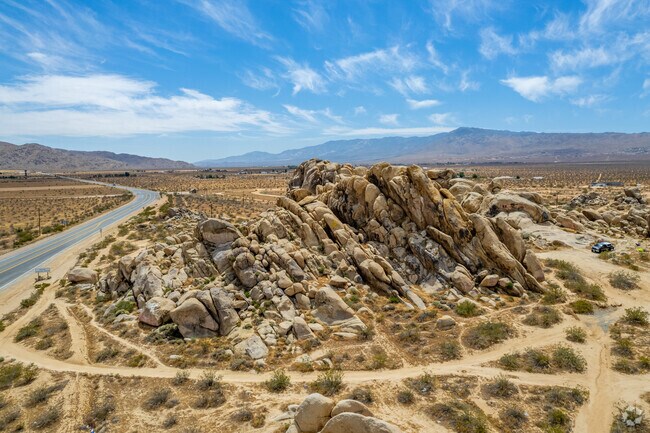
Popular rock formations attract rock climbers to Apple Valley from far and wide.
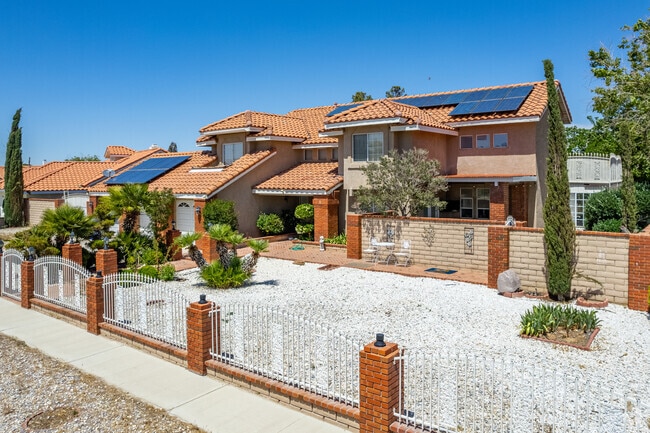
Apple Valley residents will find Spanish-style homes ranging from $400,000 to $700,000.
Apple Valley Town Square brings the community together on a warm day.
Town's End Still House is a popular place to eat and come for a drink with live music.
Viva Maria is a great place for Mexican food at a nice sit-down restaurant.
Median Household Income
$68,933
Average: $88,298
Education
11,265
Residents Have a Degree
Job Market
29,652
Workers Employed
Median Age
38 Years
Largest Age Group
10-19 Years
Approximately 14% of Residents
Under 20
27%
Over 65
20%
Housing Distribution
Apple Valley has more homeowners than renters.

Education Distribution
Review this city's overall education levels.

As of July 2026, the average apartment rent in Apple Valley, CA is $584 for a studio, $735 for one bedroom, $986 for two bedrooms, and $1,616 for three bedrooms. Apartment rent in Apple Valley has increased by 1.9% in the past year.
Explore how walkable, bikeable, drivable, and transit-friendly Apple Valley, CA is for everyday living.
Somewhat Walkable
Walkability
Limited Public Transit
Transit
Very Drivable
Drivability
Somewhat Bikeable
Bikeability
Academy for Academic Excellence
Public
Grades K-12
1,489 Students

Public
Grades K-5
616 Students

Public
Grades K-5
616 Students
Public
Grades K-8
1,153 Students

Desert Knolls Elementary School
Public
Grades K-5
582 Students
Academy for Academic Excellence
Public
Grades K-12
1,489 Students
Public
Grades K-8
1,153 Students
Public
Grades K-8
1,695 Students

Public
Grades K-8
848 Students

Public
Grades K-8
848 Students
Academy for Academic Excellence
Public
Grades K-12
1,489 Students
Public
Grades 9-12
2,211 Students
Public
Grades 9-12
2,211 Students
Public
Grades 9-12
1,791 Students
Public
Grades 9-12
1,791 Students
† Our analysis of utilities, groceries, transportation, healthcare, home prices, and other goods and services is sourced from the Cost of Living Index, a respected benchmark published by the Council for Community and Economic Research (C2ER) that provides a thorough overview of living expenses across different regions.
Rent data is provided by CoStar Group’s Market Trend reports. As the industry leader in commercial real estate information, analytics, and news, CoStar conducts extensive research to produce and maintain a comprehensive database of commercial real estate information. We combine this data with public record to provide the most up-to-date rental information available.
Consumer goods, services, and home prices are sourced from the Cost of Living Index published by the Council for Community and Economic Research (C2ER). The data on this page is updated quarterly. It was last published in June 2026.
Demographic information comes from Neustar and combines detailed address data with U.S. Census and American Community Survey statistics to produce reliable local estimates.


