
Median Age
35 Years
Largest Age Group
30-39 Years
Approximately 15% of Residents
Under 20
27%
Over 65
14%


Avg Rent
$1,476
Population
125,250
Renter Mix
58% Rent
Allentown sits at the center of Pennsylvania's Lehigh Valley, holding the distinction of being the state's third-largest city and a place where history runs deep. During the Revolutionary War, the Liberty Bell was secretly sheltered here at Zion Reformed Church, a detail that captures how long this city has been part of something larger. Today, Allentown draws renters with a working downtown anchored by PPL Center and Miller Symphony Hall, while neighborhoods like the West End, Old Allentown Historic District, and the Hamilton District each carry a distinct character. Muhlenberg College and Cedar Crest College add an academic presence that shapes the city's cultural energy year-round. The Great Allentown Fair, held at the Fairgrounds since 1852, remains one of the region's most enduring annual traditions. Healthcare and technology are significant economic drivers, with Lehigh Valley Hospital serving as one of the area's largest employers. Renters will find a solid mix of restored rowhouses, apartment communities in converted historic buildings, and newer downtown units. The range of options and comparatively accessible price points make Allentown a practical choice for those wanting proximity to Philadelphia and New York without the cost of living in either.
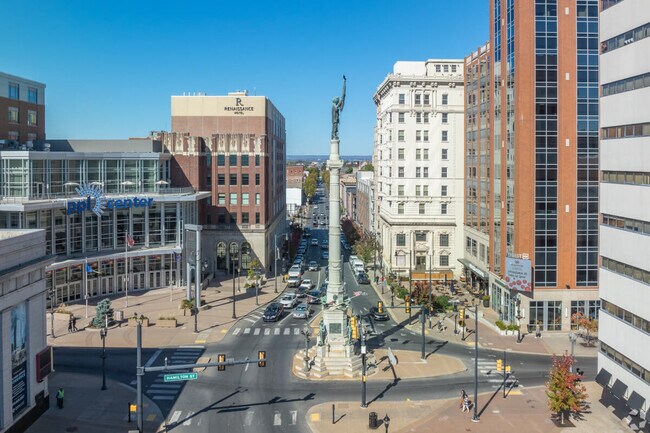
The Soldier and Sailors Monument sits at the center of Allentown.
The Allentown Fairgrounds Farmers Market is always packed.
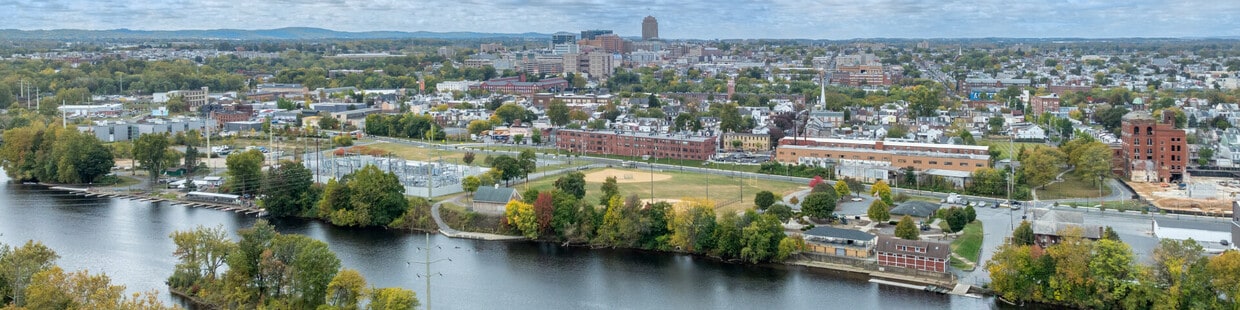
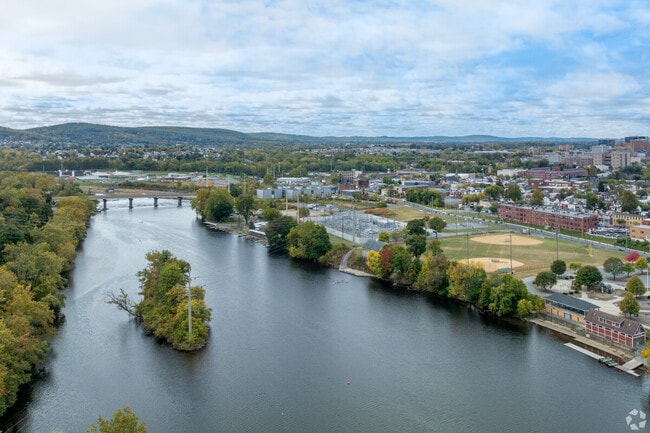
The Lehigh River provides a scenic backdrop.
Median Household Income
$47,288
Average: $63,145
Education
20,190
Residents Have a Degree
Job Market
58,877
Workers Employed
Median Age
35 Years
Largest Age Group
30-39 Years
Approximately 15% of Residents
Under 20
27%
Over 65
14%
Housing Distribution
Allentown has more renters than homeowners.

Education Distribution
Review this city's overall education levels.

As of July 2026, the average apartment rent in Allentown, PA is $1,208 for a studio, $1,477 for one bedroom, $1,825 for two bedrooms, and $2,286 for three bedrooms. Apartment rent in Allentown has increased by 2.5% in the past year.
The cost of living in Allentown, PA is 1.9% higher than the national average. Generally, housing in Allentown is 8.0% more expensive than the national average, with rent falling between $1,209 - $2,107. You can expect to pay 1.9% less for groceries, 4.1% more for utilities, and 5.5% more for transportation.
Compare Cities
Explore how walkable, bikeable, drivable, and transit-friendly Allentown, PA is for everyday living.
Moderately Walkable
Walkability
Limited Public Transit
Transit
Very Drivable
Drivability
Fairly Bikeable
Bikeability
Public
Grades K-5
497 Students

Public
Grades K-5
530 Students

Public
Grades K-5
483 Students
Lehigh Parkway Elementary School
Public
Grades K-5
276 Students
Public
Grades K-5
461 Students

Public
Grades 6-8
1,329 Students
Executive Education Academy Charter School
Public
Grades K-12
1,497 Students

Public
Grades K-8
479 Students
Lincoln Leadership Academy Charter School
Public
Grades K-12
899 Students

Public
Grades 6-8
704 Students

Public
Grades 9-12
3,220 Students
Executive Education Academy Charter School
Public
Grades K-12
1,497 Students
Public
Grades 9-12
546 Students
Lincoln Leadership Academy Charter School
Public
Grades K-12
899 Students
Public
Grades 9-12
3,074 Students

† Our analysis of utilities, groceries, transportation, healthcare, home prices, and other goods and services is sourced from the Cost of Living Index, a respected benchmark published by the Council for Community and Economic Research (C2ER) that provides a thorough overview of living expenses across different regions.
Rent data is provided by CoStar Group’s Market Trend reports. As the industry leader in commercial real estate information, analytics, and news, CoStar conducts extensive research to produce and maintain a comprehensive database of commercial real estate information. We combine this data with public record to provide the most up-to-date rental information available.
Consumer goods, services, and home prices are sourced from the Cost of Living Index published by the Council for Community and Economic Research (C2ER). The data on this page is updated quarterly. It was last published in June 2026.
Demographic information comes from Neustar and combines detailed address data with U.S. Census and American Community Survey statistics to produce reliable local estimates.


