
Olympic Gardens Apartments
1229 Pericles Pl,
Whitehall, PA 18052
$1,725 - $1,925
1-2 Beds


Located in Pennsylvania's Lehigh Valley, Allentown combines city convenience with neighborhood charm. The downtown area continues to grow, centered around the PPL Center arena, with an expanding selection of restaurants and cultural venues. The city's architecture tells its story through preserved Victorian homes in historic districts and craftsman-style houses along the West End's tree-lined streets. Outdoor enthusiasts can explore the Lehigh Parkway and Cedar Beach, which offer miles of trails and recreational spaces. Allentown is also home to Muhlenberg College and Cedar Crest College, contributing to the city's educational landscape.
Housing choices include downtown apartments in restored buildings and homes throughout established neighborhoods. The rental market remains stable, with one-bedroom apartments averaging $1,415, showing a 1.64% annual increase. Residential options span from the Old Allentown district to the West End and East Side communities. The city's economy continues to evolve, particularly in the healthcare and technology sectors. Local landmarks include the Allentown Art Museum, Miller Symphony Hall, and the Allentown Fairgrounds, home to the Great Allentown Fair since 1852. The city holds significant historical importance - during the Revolutionary War, the Liberty Bell found sanctuary in Allentown's Zion Reformed Church after being evacuated from Philadelphia in 1777.
The Allentown Fairgrounds Farmers Market is always packed.
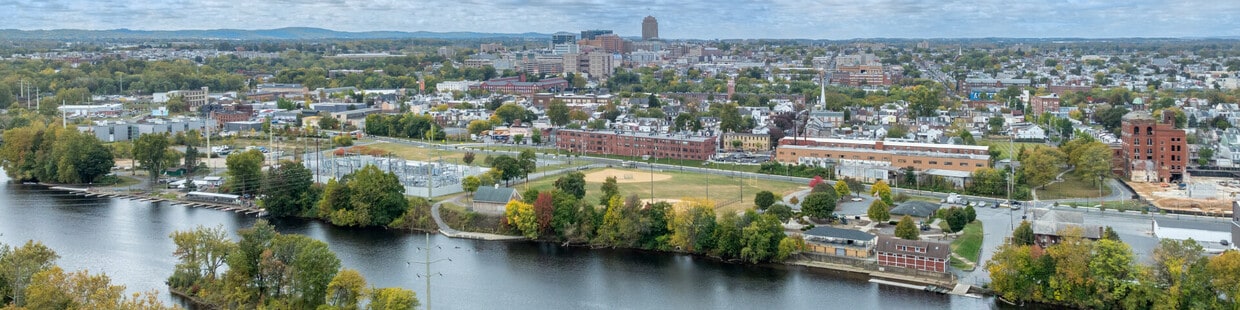
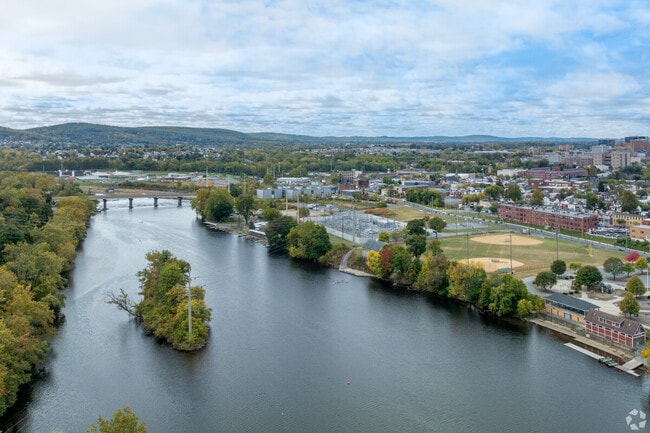
The Lehigh River provides a scenic backdrop.
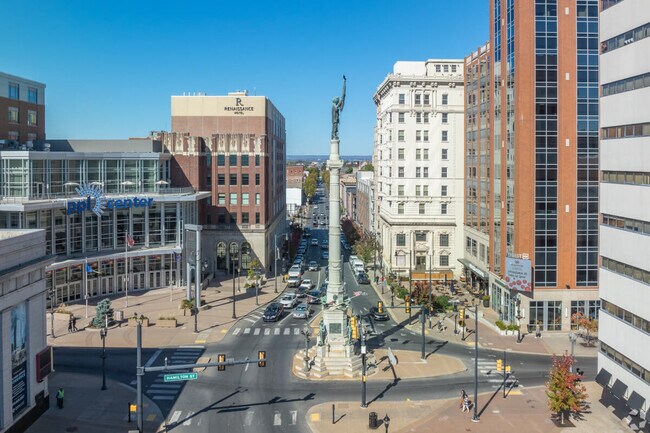
The Soldier and Sailors Monument sits at the center of Allentown.
As of March 2026, the average apartment rent in Allentown, PA is $1,217 for a studio, $1,459 for one bedroom, $1,806 for two bedrooms, and $2,286 for three bedrooms. Apartment rent in Allentown has increased by 2.7% in the past year.
The cost of living in Allentown, PA is 1.6% higher than the national average. Generally, housing in Allentown is 7.6% more expensive than the national average, with rent falling between $1,217 - $2,286. You can expect to pay 2.4% less for groceries, 3.4% more for utilities, and 4.8% more for transportation.
Explore how walkable, bikeable, drivable, and transit-friendly Allentown, PA is for everyday living.
Somewhat Walkable
You might be able to get out and walk when living in this area. Some errands can be accomplished on foot, but for others you’ll need a car.
Some Transit
You'll likely want a car when living in this area since it has few transit options.
Somewhat Bikeable
You might be able to find places to ride your bike in this area, but you’ll most likely want your car for most errands.
Public
Grades K-5

Public
Grades K-5
Public
Grades K-5
Public
Grades K-5

Public
Grades K-8
Public
Grades 6-8

Public
Grades K-8
Executive Education Academy Charter School
Public
Grades K-12
Lincoln Leadership Academy Charter School
Public
Grades K-12

Public
Grades K-8

Public
Grades 9-12
Executive Education Academy Charter School
Public
Grades K-12
Public
Grades 9-12
Lincoln Leadership Academy Charter School
Public
Grades K-12
Public
Grades 9-12


48
Communities
5,514
Units
34
Cities

27
Communities
4,813
Units
12
Cities

391
Communities
108,446
Units
239
Cities

54
Communities
9,317
Units
30
Cities

19
Communities
4,243
Units
15
Cities

10
Communities
1,444
Units
8
Cities
† Our analysis of utilities, groceries, transportation, healthcare, home prices, and other goods and services is sourced from the Cost of Living Index, a respected benchmark published by the Council for Community and Economic Research (C2ER) that provides a thorough overview of living expenses across different regions.
Rent data is provided by CoStar Group’s Market Trend reports. As the industry leader in commercial real estate information, analytics, and news, CoStar conducts extensive research to produce and maintain a comprehensive database of commercial real estate information. We combine this data with public record to provide the most up-to-date rental information available.
Consumer goods, services, and home prices are sourced from the Cost of Living Index published by the Council for Community and Economic Research (C2ER). The data on this page is updated quarterly. It was last published in February 2026.


