Published on
Since the start of 2026, annual multifamily rent growth has remained nearly stable, hovering between 0.5 and 0.6 percent. This plateau stands in contrast to the acceleration typically seen during the spring leasing season, when leasing activity picks up.
In the latest example of this slowdown, national annual rent growth decelerated slightly from 0.6 percent (the adjusted annual rent growth rate for March) to 0.5 percent in April, according to the latest rent growth report from Apartments.com.
Oversupply challenges linger as demand weakens
This year’s flattening rent growth trendline is driven by two simultaneous forces: continued elevated supply and slowing renter demand.
After peaking in 2024 with nearly 700,000 units delivered, new additions have tapered off, but excess supply continues to hinder rent growth and keep vacancy rates elevated.
The robust demand required to absorb this supply has not materialized. Instead, renter demand has weakened, thanks to a slowdown in population growth and challenging labor market.
As a result, April’s annual rent growth of 0.5 percent stands in sharp contrast to the rate for a year ago: 1.4 percent.
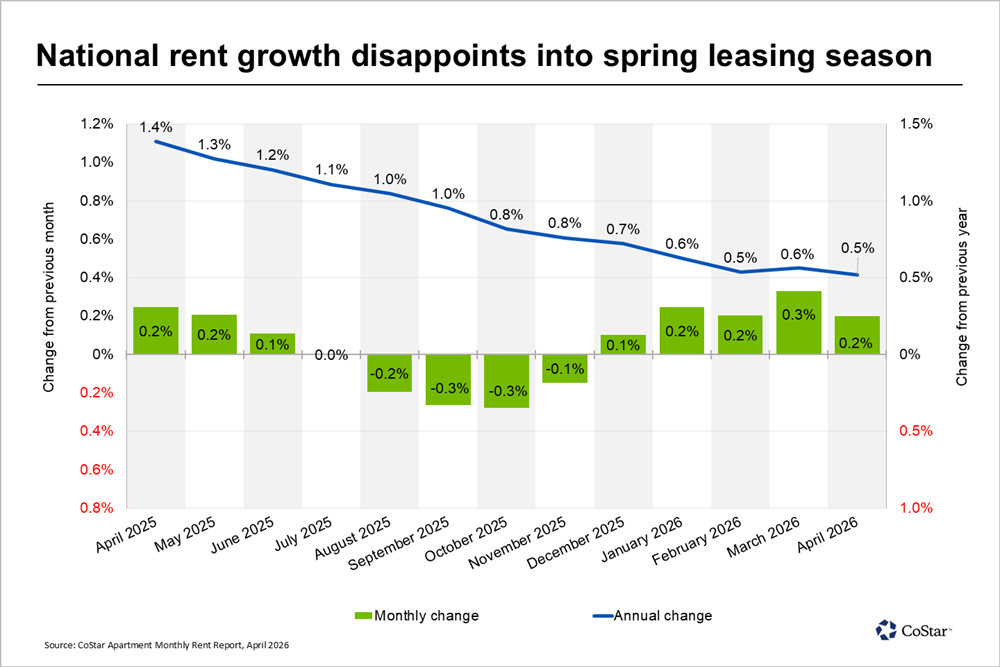
Month-over-month change has also slowed down significantly. The 0.2 percent monthly change marks the weakest monthly rent growth from March to April seen in the last six years.
Pacific region posts strong performance, close behind Midwest and Northeast
At the regional level, the Midwest continued its lead, driven by a healthy balance of supply and demand. As of April, the Midwest region posted 2.0 percent rent growth, four times the national average.
The Northeast region, which has also enjoyed a low rate of supply additions relative to demand, maintained its spot in second place, with the undersupplied Pacific region hot on its heels. The Northeast saw annual rent growth of 1.1 percent, while rents in the Pacific region increased by 1.0 percent.
In the South and Mountain regions, rents declined year over year by 1.1 percent and 1.9 percent, respectively. Multifamily markets in these regions have borne the brunt of the post-pandemic supply wave, with slowing demand failing to meet the elevated supply.
San Francisco rent growth speeds up, spurring increases across the Bay Area
At the market level, year-over-year rent growth was positive for just over half of major metropolitan areas. Monthly change was more positive, with 45 out of 50 major metros posting increases since March.
San Francisco, which has led annual rent growth charts for six straight quarters, continued its lead. Rent growth in the high-cost market expanded further, with San Francisco also taking the top spot for greatest month-over-month increase.
This acceleration brought San Francisco’s annual rent growth to 7.3 percent, three points above fellow Bay Area runner-up San Jose, which ranked second with 4.3 percent.
The jump in asking rents in San Francisco has helped drive up rents throughout the Bay Area. Across the Bay from San Francisco, the East Bay rose to the sixth spot with 2.1 percent rent growth.
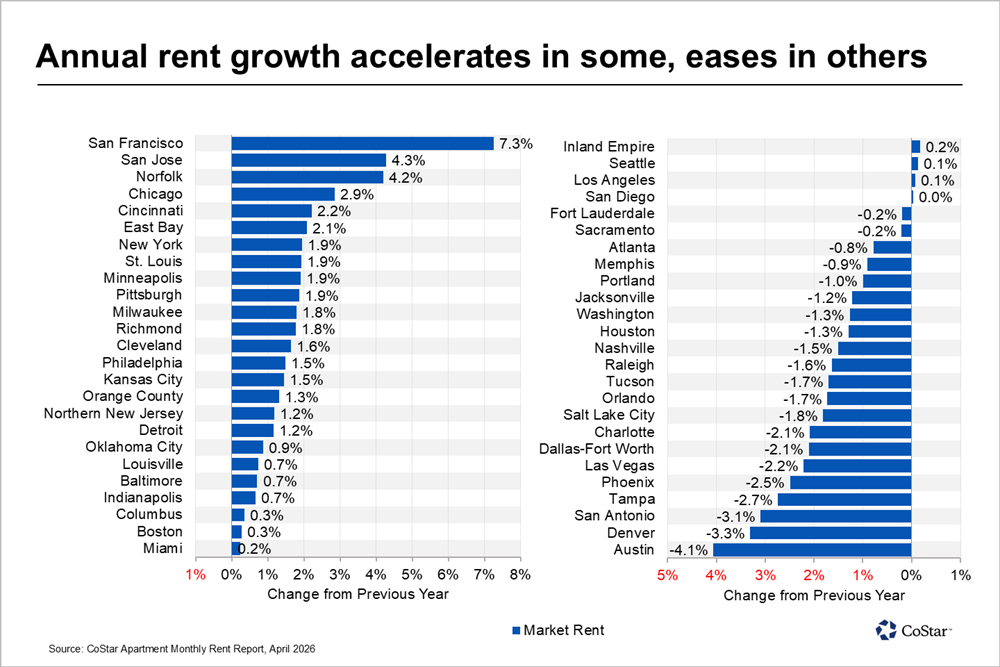
Norfolk, Virginia ranked third for rent growth, posting growth of 4.2 percent. Also known as the Hampton Roads market, this coastal multifamily market has sustained strong rent growth in recent years, thanks to its healthy demand and limited supply pipeline. At the end of 2025, new supply additions made up just under 1 percent of Norfolk’s total inventory, well below the national average of 2.6 percent. Norfolk has ranked among the top five markets for rent growth for five straight quarters.
High-performing Midwest and Northeast markets made up the rest of the top 10. Chicago came in fourth with 2.9 percent, followed by Cincinnati at 2.2 percent. New York ranked seventh, followed by St. Louis, Minneapolis, and Pittsburgh, with all four markets posting 1.9 percent rent growth.
Austin faces continued supply challenges, along with Mountain and South regions
At the other end of the scale, Austin remains at the bottom of the list. Rents in the oversupplied Texas capital declined year over year by 4.1 percent. Denver, where the multifamily vacancy rate has remained in double digits since mid-2024, came in second to last with negative 3.3 percent rent growth.
Markets across the Sun Belt in the Mountain and South regions dominated the bottom of the chart, including San Antonio (negative 3.1 percent), Tampa (negative 2.7 percent), Phoenix (negative 2.5 percent), Las Vegas (negative 2.2 percent), Dallas-Fort Worth (negative 2.1 percent), Charlotte (negative 2.1 percent), Salt Lake City (negative 1.8 percent), and Orlando (negative 1.7 percent).
Overall, 21 of the top 50 major multifamily markets saw negative annual rent growth in April.