Median Age
34 Years
Largest Age Group
30-39 Years
Approximately 15% of Residents
Under 20
28%
Over 65
14%


Area Guide
Avg Rent
$1,371
Population
45,802
Renter Mix
66% Rent
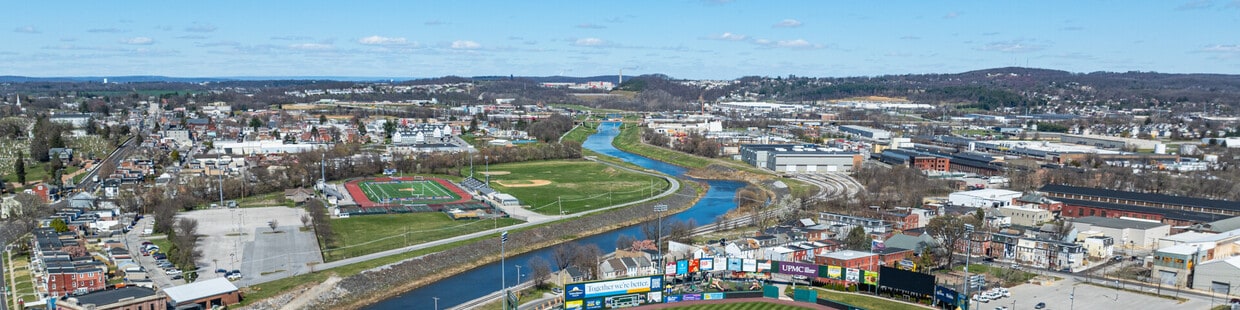
York, Pennsylvania carries a distinct sense of place rooted in American history — the Continental Congress met here in 1777 and 1778, and the Articles of Confederation were drafted within the city's borders. That heritage is woven into the everyday fabric of life, from the preserved architecture around Continental Square to the Fairmount District's Victorian streetscapes. As the county seat of York County and the largest city in the York-Hanover metro area, York anchors a broader region that draws on a mix of manufacturing, healthcare, and education. Harley-Davidson maintains a significant facility here, and York College of Pennsylvania adds an academic presence that shapes the city's character year-round. The housing stock reflects York's layered history, offering renters everything from row homes in walkable downtown blocks to apartment communities in quieter residential corridors. Compared to Philadelphia or Pittsburgh, rents remain accessible, giving renters more space for their dollar without sacrificing proximity to a genuine urban core. Downtown York has seen steady reinvestment, and the Appell Center for the Performing Arts anchors a growing arts scene. The York State Fair, held each fall, draws the wider region together and speaks to the city's deep agricultural and community roots.
The Heritage Rail Trail runs along Cordorus Creek and is popular with York bikers and runners.
The York Galleria in has over 70 shops for residents of York to explore.
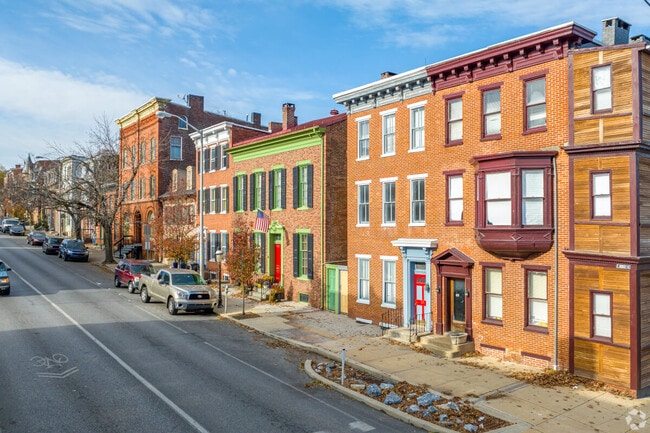
Classic Philadelphia style brownstones in York show its settlers' roots from Philly.
Median Household Income
$39,788
Average: $54,151
Education
7,191
Residents Have a Degree
Job Market
20,790
Workers Employed
Median Age
34 Years
Largest Age Group
30-39 Years
Approximately 15% of Residents
Under 20
28%
Over 65
14%
Housing Distribution
York has more renters than homeowners.

Education Distribution
Review this city's overall education levels.

As of June 2026, the average apartment rent in York, PA is $1,175 for a studio, $1,370 for one bedroom, $1,544 for two bedrooms, and $1,834 for three bedrooms. Apartment rent in York has increased by 1.5% in the past year.
The cost of living in York, PA is 3.1% lower than the national average. Generally, housing in York is 10.9% less expensive than the national average, with rent falling between $1,175 - $1,834. You can expect to pay 6.3% less for groceries, 9.9% more for utilities, and 8.2% more for transportation.
Compare Cities
Explore how walkable, bikeable, drivable, and transit-friendly York, PA is for everyday living.
Fairly Walkable
Walkability
Limited Public Transit
Transit
Moderately Drivable
Drivability
Fairly Bikeable
Bikeability
Loganville-Springfield El School
Public
Grades K-5
459 Students

Public
Grades K-5
572 Students

Public
Grades K-5
414 Students

Public
Grades K-5
640 Students

Public
Grades K-5
415 Students
Public
Grades 6-8
881 Students
Public
Grades 6-8
713 Students

York Academy Regional Charter School
Public
Grades K-12
963 Students

Public
Grades PK-8
695 Students
Public
Grades 6-8
675 Students
Public
Grades 9-12
1,807 Students
York Suburban Senior High School
Public
Grades 9-12
873 Students
Public
Grades 9-12
869 Students
York Academy Regional Charter School
Public
Grades K-12
963 Students
Public
Grades 9-12
1,620 Students

† Our analysis of utilities, groceries, transportation, healthcare, home prices, and other goods and services is sourced from the Cost of Living Index, a respected benchmark published by the Council for Community and Economic Research (C2ER) that provides a thorough overview of living expenses across different regions.
Rent data is provided by CoStar Group’s Market Trend reports. As the industry leader in commercial real estate information, analytics, and news, CoStar conducts extensive research to produce and maintain a comprehensive database of commercial real estate information. We combine this data with public record to provide the most up-to-date rental information available.
Consumer goods, services, and home prices are sourced from the Cost of Living Index published by the Council for Community and Economic Research (C2ER). The data on this page is updated quarterly. It was last published in June 2026.
Demographic information comes from Neustar and combines detailed address data with U.S. Census and American Community Survey statistics to produce reliable local estimates.


