
Fallbrook Flats
3883 E Market St,
York, PA 17402
$1,600 - $2,199
1-3 Beds
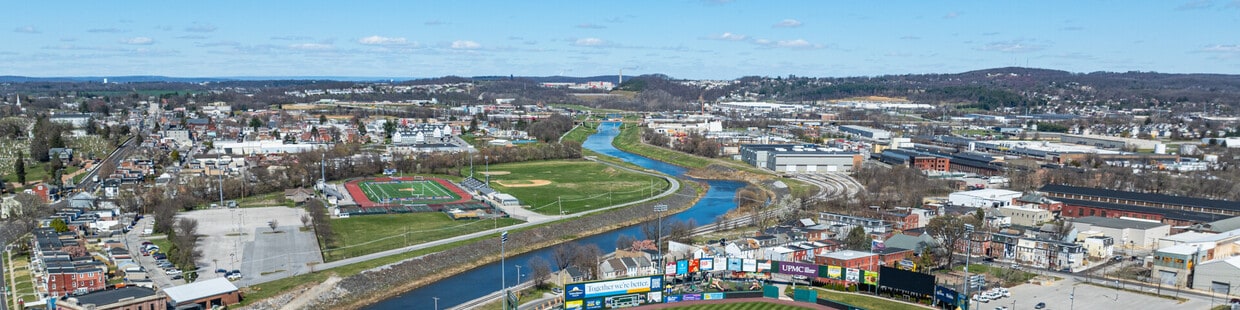


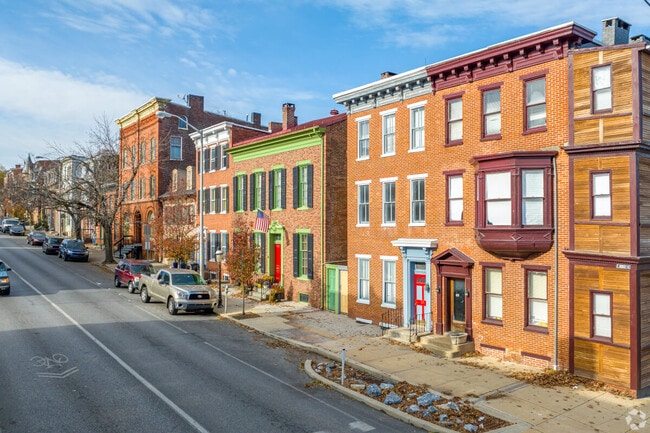
Welcome to York, Pennsylvania, nestled in the Susquehanna Valley. The city offers renters a range of housing options, from historic row homes in downtown to contemporary apartments in surrounding neighborhoods. The rental market remains more affordable than larger Pennsylvania cities, with one-bedroom apartments averaging $1,353, reflecting a 4.8% increase over the past year. Notable areas include the Fairmount District, with its preserved Victorian architecture, and the downtown area near Continental Square, where residents enjoy easy access to local attractions.
York's story intertwines with America's founding - the city served as the temporary capital of the Continental Congress in 1777-1778, where the Articles of Confederation were drafted. Today, residents explore the historic York Central Market House, attend shows at the Appell Center for the Performing Arts, and cheer on the York Revolution baseball team at WellSpan Park. The York County Heritage Rail Trail provides opportunities for walking, biking, and running. York College of Pennsylvania enhances the community's educational landscape, while the York State Fair, America's oldest fair established in 1765, continues as a beloved annual tradition. The city maintains its industrial roots, with the Harley-Davidson manufacturing facility serving as one of the area's major employers.
The York Galleria in has over 70 shops for residents of York to explore.
Classic Philadelphia style brownstones in York show its settlers' roots from Philly.
The Heritage Rail Trail runs along Cordorus Creek and is popular with York bikers and runners.
As of March 2026, the average apartment rent in York, PA is $1,178 for a studio, $1,367 for one bedroom, $1,541 for two bedrooms, and $1,820 for three bedrooms. Apartment rent in York has increased by 1.1% in the past year.
The cost of living in York, PA is 3.1% lower than the national average. Generally, housing in York is 10.9% less expensive than the national average, with rent falling between $1,178 - $1,820. You can expect to pay 6.3% less for groceries, 9.9% more for utilities, and 8.2% more for transportation.
Explore how walkable, bikeable, drivable, and transit-friendly York, PA is for everyday living.
Somewhat Walkable
You might be able to get out and walk when living in this area. Some errands can be accomplished on foot, but for others you’ll need a car.
Minimal Transit
You'll likely want a car when living in this area since it has few transit options.
Somewhat Bikeable
You might be able to find places to ride your bike in this area, but you’ll most likely want your car for most errands.
Loganville-Springfield El School
Public
Grades K-5

Public
Grades K-5

Public
Grades K-5

Public
Grades K-5

Public
Grades K-5
Public
Grades 6-8
Public
Grades 6-8

York Academy Regional Charter School
Public
Grades K-12

Public
Grades 6-8
Public
Grades PK-8
York Suburban Senior High School
Public
Grades 9-12
Public
Grades 9-12
Public
Grades 9-12
York Academy Regional Charter School
Public
Grades K-12
William Penn Senior High School
Public
Grades 9-12

11
Communities
2,494
Units
9
Cities

54
Communities
9,317
Units
30
Cities

18
Communities
3,278
Units
15
Cities
391
Communities
108,446
Units
239
Cities

75
Communities
20,184
Units
52
Cities

44
Communities
3,678
Units
39
Cities
† Our analysis of utilities, groceries, transportation, healthcare, home prices, and other goods and services is sourced from the Cost of Living Index, a respected benchmark published by the Council for Community and Economic Research (C2ER) that provides a thorough overview of living expenses across different regions.
Rent data is provided by CoStar Group’s Market Trend reports. As the industry leader in commercial real estate information, analytics, and news, CoStar conducts extensive research to produce and maintain a comprehensive database of commercial real estate information. We combine this data with public record to provide the most up-to-date rental information available.
Consumer goods, services, and home prices are sourced from the Cost of Living Index published by the Council for Community and Economic Research (C2ER). The data on this page is updated quarterly. It was last published in February 2026.


