Median Age
37 Years
Largest Age Group
10-19 Years
Approximately 15% of Residents
Under 20
28%
Over 65
17%
Avg Rent
$1,094
Population
9,802
Renter Mix
42% Rent
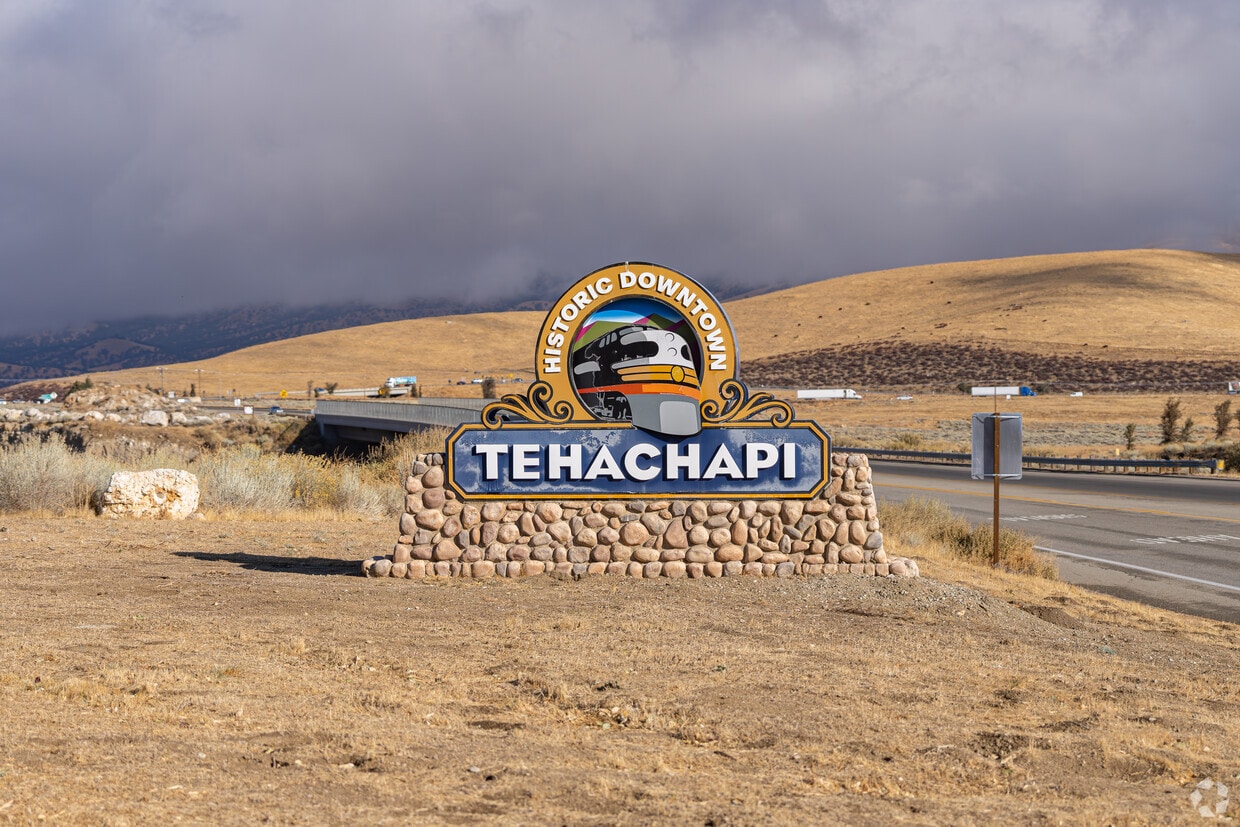
Tehachapi sits at the crossroads of the Tehachapi Mountains, the San Joaquin Valley, and the Mojave Desert, giving this small Kern County city a setting unlike anything else in Southern California. Perched at roughly 4,000 feet in elevation, the area earns its reputation as the "Land of Four Seasons," with warm summers, genuine winters, and crisp air that sets it apart from the sun-baked lowlands nearby. The city's compact downtown is dotted with preserved vintage storefronts and old-school marquees that give it a grounded, unhurried character. Edwards Air Force Base is a key regional employer within driving range, and Bakersfield College sits about 40 miles away for those pursuing continuing education.
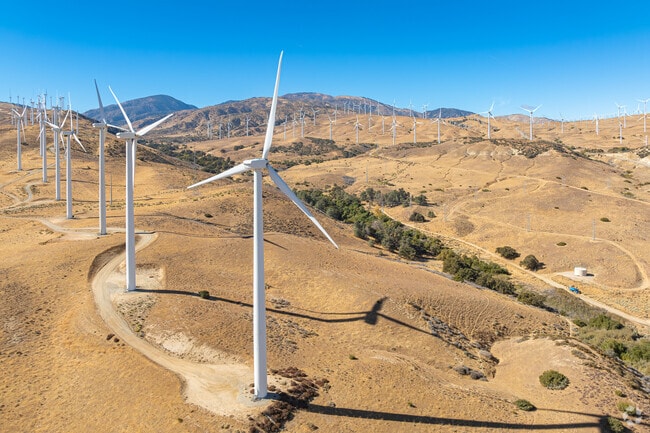
The housing mix in Tehachapi leans toward single-family homes, but renters will also find apartment communities offering one- to three-bedroom floor plans, along with some townhome-style rentals that reflect the area's mountain-town aesthetic. The rental market here is notably more accessible than most of California, making it an appealing option for those who want open skies and room to breathe without straying too far from the state's broader economic corridors. The nearby Tehachapi Loop, a feat of 19th-century railroad engineering and a celebrated landmark among rail enthusiasts, is a quiet reminder that this city carries a history well worth exploring.
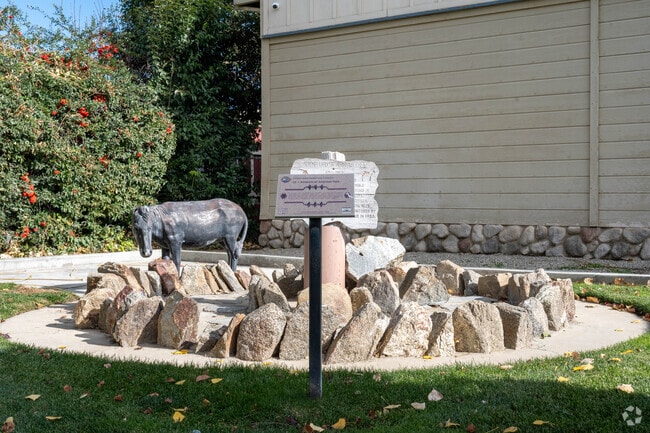
Check out cool sculptures in downtown Tehachapi.
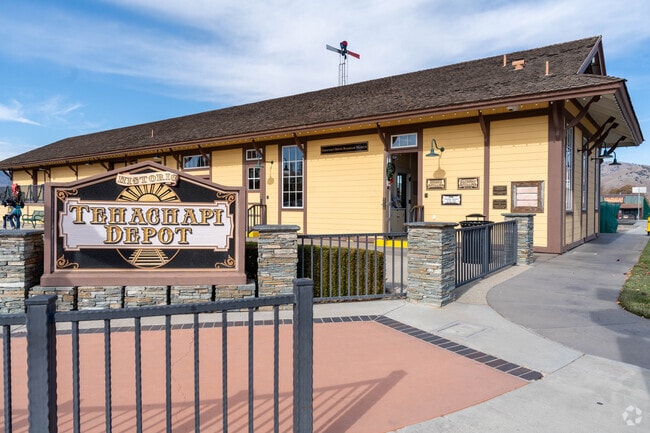
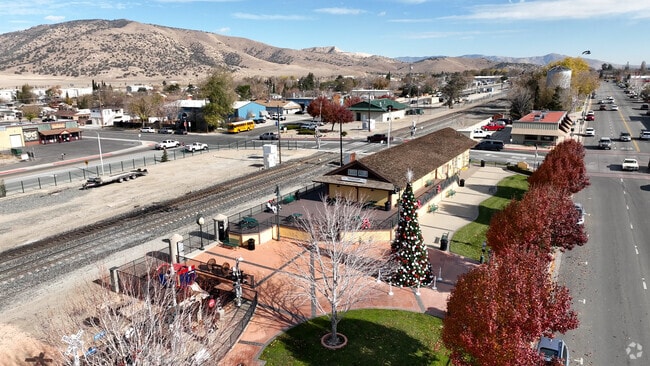
Depot Station an old railroad station located in Tehachapi.
Residents can enjoy all four seasons living in Tehachapi.
Tehachapi Water tower stands tall in the middle of downtown Tehachapi.
Tehachapi Museum celebrates the city's history.
Tehachapi's Depot contains most of the railroad history in Tehachapi.
Median Household Income
$55,661
Average: $74,994
Education
2,103
Residents Have a Degree
Job Market
3,512
Workers Employed
Median Age
37 Years
Largest Age Group
10-19 Years
Approximately 15% of Residents
Under 20
28%
Over 65
17%
Housing Distribution
Tehachapi has more homeowners than renters.

Education Distribution
Review this city's overall education levels.

As of July 2026, the average apartment rent in Tehachapi, CA is $1,094 for one bedroom, $1,355 for two bedrooms, and $1,706 for three bedrooms. Apartment rent in Tehachapi has increased by 1.3% in the past year.
Explore how walkable, bikeable, drivable, and transit-friendly Tehachapi, CA is for everyday living.
Somewhat Walkable
Walkability
Exceptionally Drivable
Drivability
Somewhat Bikeable
Bikeability
Public
Grades K-5
560 Students

Cummings Valley Elementary School
Public
Grades K-5
560 Students
Golden Hills Elementary School
Public
Grades K-5
663 Students

Public
Grades K-5
663 Students
Public
Grades K-5
615 Students

Public
Grades 6-8
925 Students

Public
Grades 6-8
925 Students
Public
Grades 9-12
1,260 Students
Public
Grades 9-12
1,260 Students
Monroe High (Continuation) School
Public
Grades 9-12
25 Students

Public
Grades 9-12
614 Students

† Our analysis of utilities, groceries, transportation, healthcare, home prices, and other goods and services is sourced from the Cost of Living Index, a respected benchmark published by the Council for Community and Economic Research (C2ER) that provides a thorough overview of living expenses across different regions.
Rent data is provided by CoStar Group’s Market Trend reports. As the industry leader in commercial real estate information, analytics, and news, CoStar conducts extensive research to produce and maintain a comprehensive database of commercial real estate information. We combine this data with public record to provide the most up-to-date rental information available.
Consumer goods, services, and home prices are sourced from the Cost of Living Index published by the Council for Community and Economic Research (C2ER). The data on this page is updated quarterly. It was last published in June 2026.
Demographic information comes from Neustar and combines detailed address data with U.S. Census and American Community Survey statistics to produce reliable local estimates.


