Median Age
40 Years
Largest Age Group
30-39 Years
Approximately 14% of Residents
Under 20
24%
Over 65
19%

Area Guide
Avg Rent
$1,499
Population
51,815
Renter Mix
32% Rent
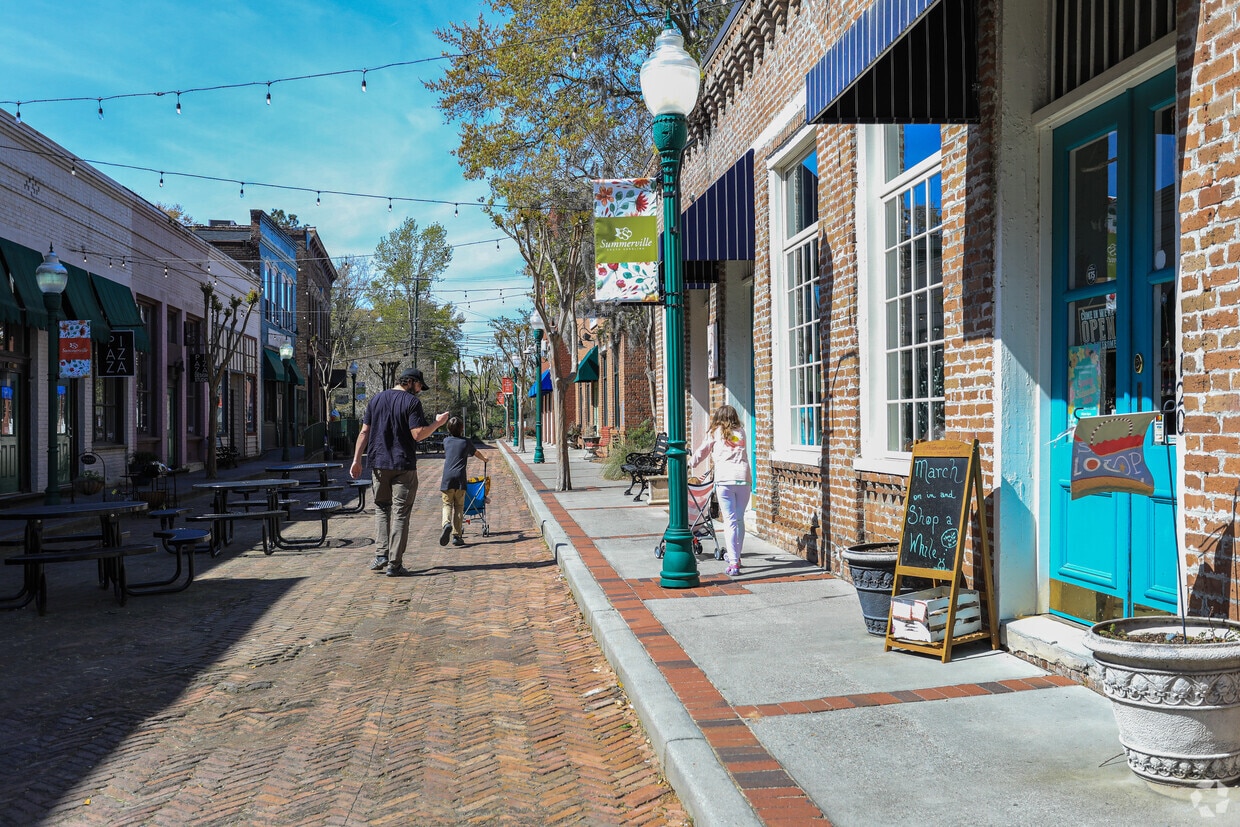
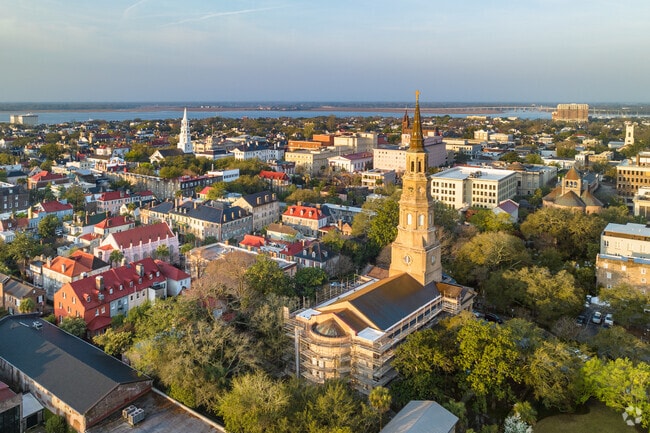
Welcome to Summerville, South Carolina, known as "Flowertown in the Pines." Located in the Charleston metropolitan area, Summerville combines historic architecture with tree-lined streets and well-maintained parks. Rental options include garden-style apartments and newer residential communities, with current average rents around $1,465 for one-bedroom units. The rental market offers various options from studios starting at $1,474 to four-bedroom homes at $2,399. Notable areas include the historic downtown district, with its walkable streets and local shops, and the Nexton area's contemporary residential communities.
Summerville's connection to nature runs deep, highlighted by its historic 1847 law protecting pine trees – the first such legislation in the nation. The town's motto, "Sacra Pinus Esto" (The Pine is Sacred), reflects this heritage. Colonial Dorchester State Historic Site and Azalea Park offer outdoor recreation opportunities, while the annual Flowertown Festival, South Carolina's largest arts and crafts festival, transforms the town each spring. Downtown Summerville features locally-owned shops and restaurants along Main Street and Short Central Avenue. Located 24 miles northwest of Charleston, Summerville provides easy access to Interstate 26 for commuters. The town offers healthcare options through Summerville Medical Center and MUSC Health facilities.
The Butterfly Sculpture at the Historic Summerville Azalea Park is an attraction to see.
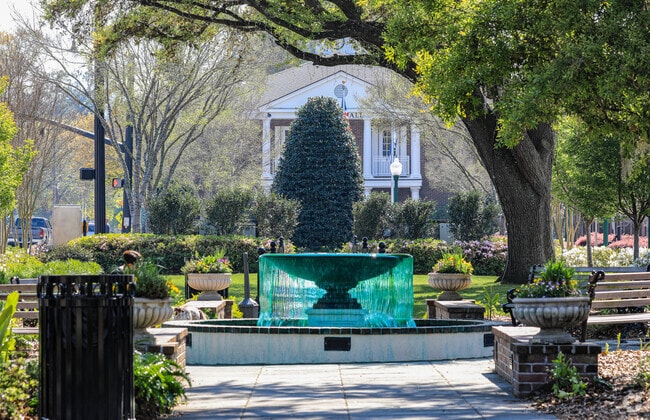
Historic Summerville Hutchinson Square Fountain.
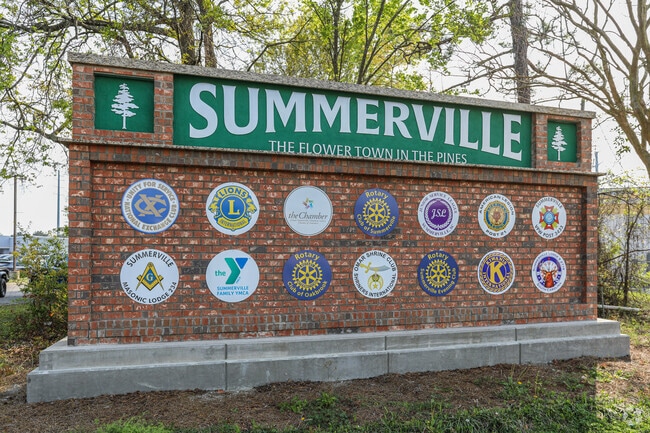
The Summerville downtown neighborhood welcoming sign shows all of the community spirit.
Homes in downtown Summerville feel very private because of the mature landscaping.
Boutiques will have sidewalk sales on sunny days in the historic section of Summerville.
Azalea Park in Summerville is a place to play and watch animals in their natural habitat.
Median Household Income
$68,803
Average: $94,562
Education
13,098
Residents Have a Degree
Job Market
25,669
Workers Employed
Median Age
40 Years
Largest Age Group
30-39 Years
Approximately 14% of Residents
Under 20
24%
Over 65
19%
Housing Distribution
Summerville has more homeowners than renters.

Education Distribution
Review this city's overall education levels.

As of July 2026, the average apartment rent in Summerville, SC is $1,795 for a studio, $1,493 for one bedroom, $1,764 for two bedrooms, and $2,199 for three bedrooms. Apartment rent in Summerville has increased by 2.7% in the past year.
Explore how walkable, bikeable, drivable, and transit-friendly Summerville, SC is for everyday living.
Somewhat Walkable
Walkability
Very Drivable
Drivability
Fairly Bikeable
Bikeability
Public
Grades PK-5
1,263 Students

Public
Grades PK-5
1,161 Students
Public
Grades PK-5
1,101 Students
Public
Grades PK-5
1,101 Students
Public
Grades PK-5
1,025 Students

Rollings Middle School Of The Arts
Public
Grades 6-8
797 Students
Public
Grades K-8

Public
Grades K-8
1,464 Students

Public
Grades 6-8
1,031 Students
Public
Grades 6-8
950 Students
Public
Grades 9-12
2,542 Students
Public
Grades 9-12
2,542 Students
Public
Grades 9-12
2,158 Students
Public
Grades 9-12
2,158 Students
Public
Grades 9-12
3,361 Students
† Our analysis of utilities, groceries, transportation, healthcare, home prices, and other goods and services is sourced from the Cost of Living Index, a respected benchmark published by the Council for Community and Economic Research (C2ER) that provides a thorough overview of living expenses across different regions.
Rent data is provided by CoStar Group’s Market Trend reports. As the industry leader in commercial real estate information, analytics, and news, CoStar conducts extensive research to produce and maintain a comprehensive database of commercial real estate information. We combine this data with public record to provide the most up-to-date rental information available.
Consumer goods, services, and home prices are sourced from the Cost of Living Index published by the Council for Community and Economic Research (C2ER). The data on this page is updated quarterly. It was last published in June 2026.
Demographic information comes from Neustar and combines detailed address data with U.S. Census and American Community Survey statistics to produce reliable local estimates.


