Median Age
26 Years
Largest Age Group
20-29 Years
Approximately 47% of Residents
Under 20
20%
Over 65
7%


Avg Rent
$1,374
Population
42,728
Renter Mix
79% Rent
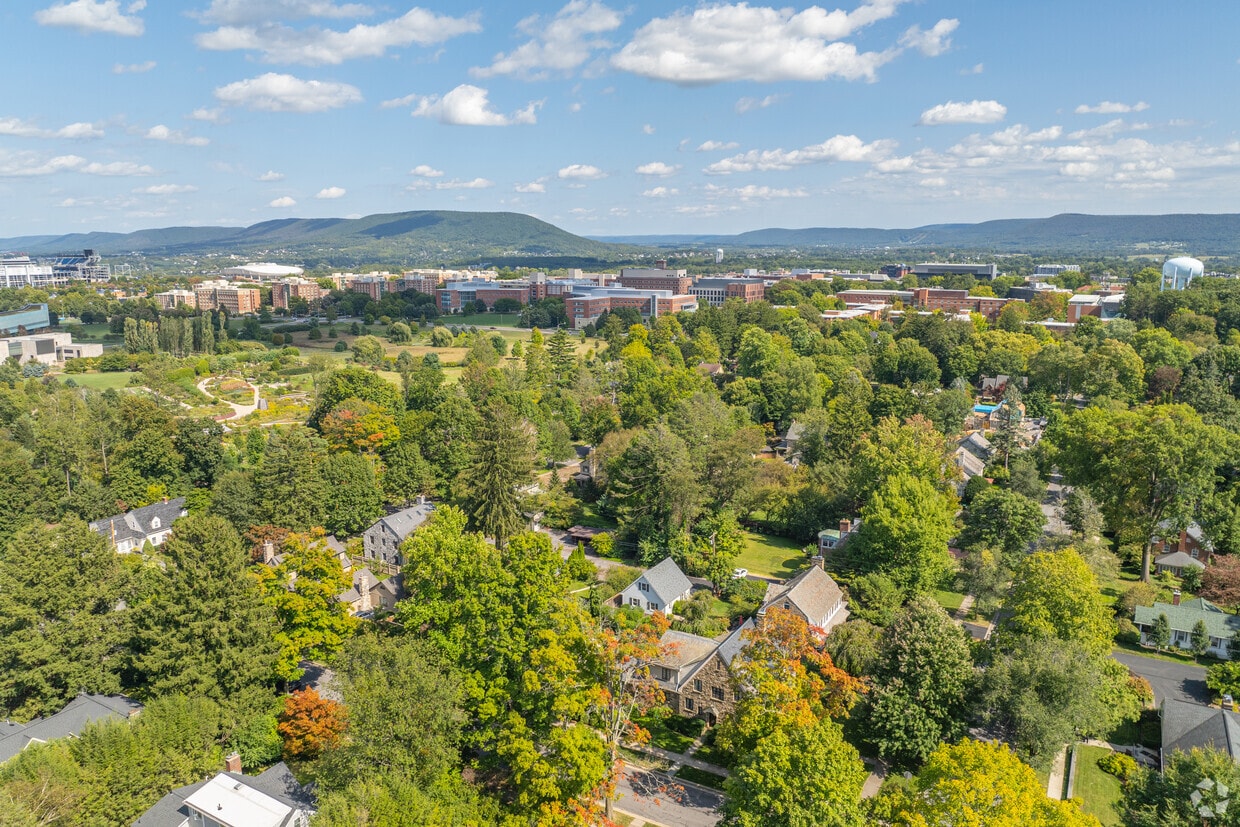
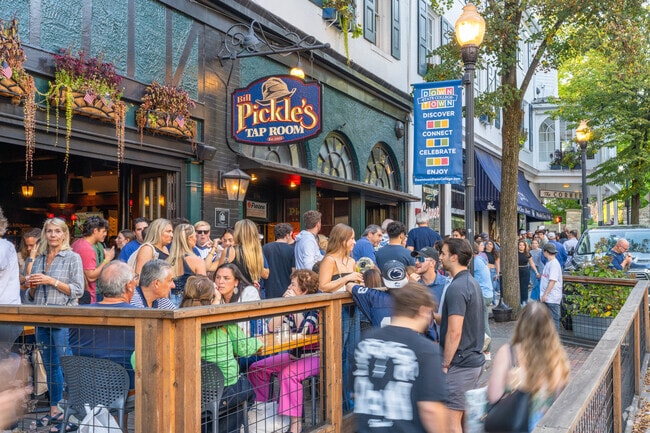
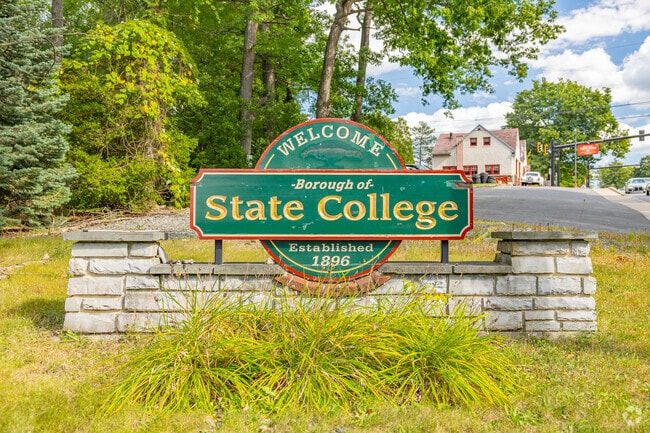
Welcome to State College, Pennsylvania, affectionately known as "Happy Valley" and home to Pennsylvania State University. This college town combines academic spirit with small-town charm. The downtown area bustles with activity, featuring independent shops and diverse dining options along College and Beaver Avenues. Housing options include apartment communities in the downtown district and rental homes in established neighborhoods like College Heights and Holmes-Foster, where tree-lined streets showcase the area's architectural heritage. Current rental trends show steady growth, with average one-bedroom apartments commanding $1,315 per month, reflecting a 5.5% increase over the past year.
State College offers abundant recreational opportunities and cultural attractions. The Central Pennsylvania Festival of the Arts transforms downtown each July, welcoming more than 125,000 visitors. Outdoor enthusiasts can explore Rothrock State Forest's extensive trail system. Beaver Stadium anchors the community's sports scene during home game weekends. The area features distinct neighborhoods, from the historic Highlands district to Orchard Park. The downtown area offers walkable access to shops and restaurants, while neighborhoods like Tusseyview and College Heights provide tree-lined streets and park access. With its combination of educational institutions, cultural activities, and natural surroundings, State College welcomes residents seeking both short-term and long-term homes.
There are many leafy, peaceful neighborhoods in the State College area.
Penn State Golf Courses offer State College residents 36 holes of pristine golfing.
Enjoying coffee at the Downtown State College Farmers Market.
State Theatre is a popular place for students and residents to catch a movie in State College.
When school is in session, Penn State is a lively place and State College comes alive.
Median Household Income
$38,752
Average: $70,363
Education
17,115
Residents Have a Degree
Job Market
15,961
Workers Employed
Median Age
26 Years
Largest Age Group
20-29 Years
Approximately 47% of Residents
Under 20
20%
Over 65
7%
Housing Distribution
State College has more renters than homeowners.

Education Distribution
Review this city's overall education levels.

As of July 2026, the average apartment rent in State College, PA is $1,210 for a studio, $1,374 for one bedroom, $1,617 for two bedrooms, and $1,746 for three bedrooms. Apartment rent in State College has increased by 4.0% in the past year.
Explore how walkable, bikeable, drivable, and transit-friendly State College, PA is for everyday living.
Moderately Walkable
Walkability
Some Public Transit
Transit
Moderately Drivable
Drivability
Fairly Bikeable
Bikeability
Public
Grades K-5
424 Students

Public
Grades K-5
250 Students
Public
Grades K-5
413 Students

Spring Creek Elementary School
Public
Grades K-5
360 Students
Centre Learning Community Charter School
Public
Grades K-8
67 Students
State College Area High School
Public
Grades 6-12
2,403 Students

Public
Grades 6-8
822 Students
Public
Grades 6-8
752 Students
Centre Learning Community Charter School
Public
Grades K-8
67 Students
Young Scholars of Central PA CS
Public
Grades K-8
371 Students

State College Area High School
Public
Grades 6-12
2,403 Students
† Our analysis of utilities, groceries, transportation, healthcare, home prices, and other goods and services is sourced from the Cost of Living Index, a respected benchmark published by the Council for Community and Economic Research (C2ER) that provides a thorough overview of living expenses across different regions.
Rent data is provided by CoStar Group’s Market Trend reports. As the industry leader in commercial real estate information, analytics, and news, CoStar conducts extensive research to produce and maintain a comprehensive database of commercial real estate information. We combine this data with public record to provide the most up-to-date rental information available.
Consumer goods, services, and home prices are sourced from the Cost of Living Index published by the Council for Community and Economic Research (C2ER). The data on this page is updated quarterly. It was last published in June 2026.
Demographic information comes from Neustar and combines detailed address data with U.S. Census and American Community Survey statistics to produce reliable local estimates.


