Median Age
38 Years
Largest Age Group
30-39 Years
Approximately 14% of Residents
Under 20
26%
Over 65
18%
Avg Rent
$987
Population
2,559
Renter Mix
40% Rent
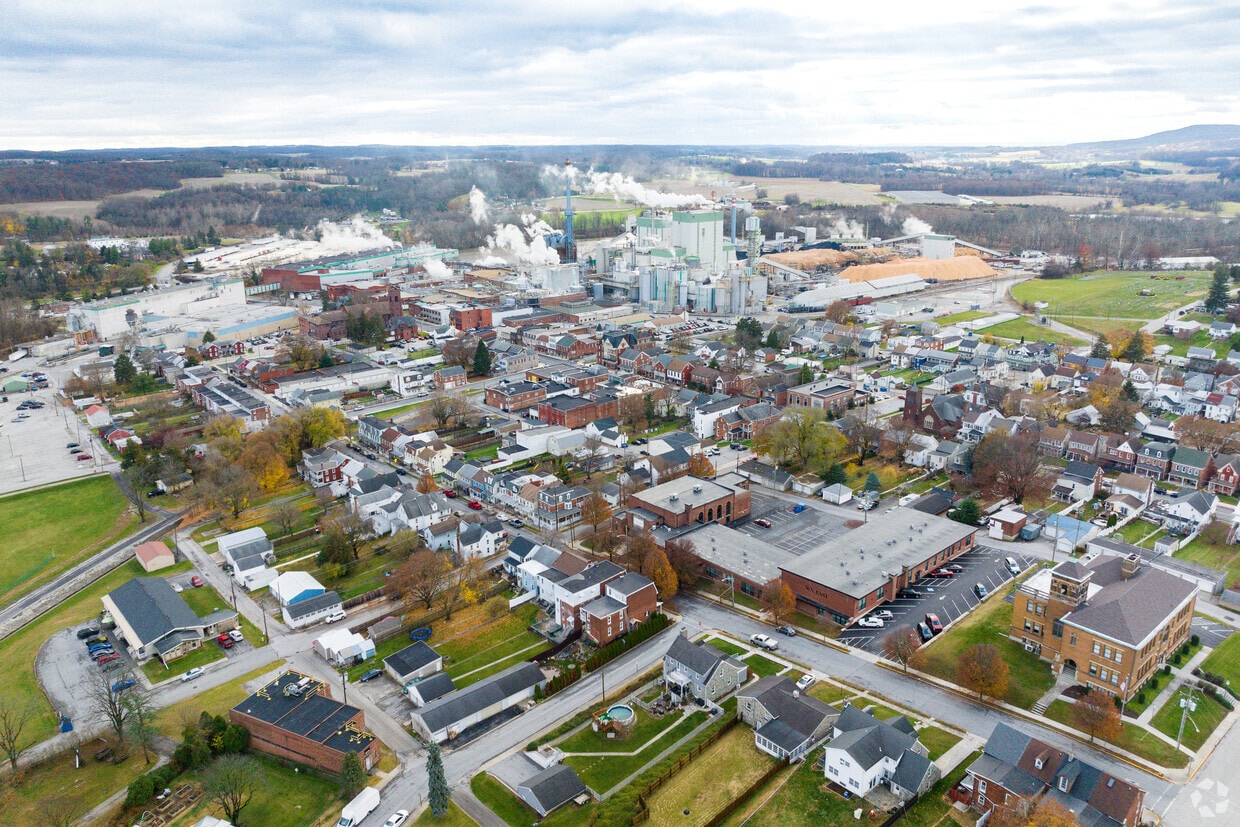
Spring Grove is a small borough in York County, Pennsylvania, tucked between the larger communities of York and Hanover. With a population of around 2,500 and just one square mile of land, it carries the close-knit character that comes with a genuinely tight geography. The borough's identity has long been tied to its industrial roots, particularly papermaking, which has shaped the local economy since the mid-1800s. That heritage gives Spring Grove a grounded, working-town feel that sets it apart from neighboring communities.
Residents enjoy easy access to the amenities of both York and Hanover, making Spring Grove a practical base without the pace of city life. Housing here leans toward traditional architecture, with brick rowhouses, modest single-family rentals, and a handful of apartment communities that offer an affordable entry point compared to larger Pennsylvania metros. The rental market reflects the borough's compact scale, with options that suit a range of needs.
Spring Grove Area School District anchors educational life in the community, and the surrounding York County region offers access to several colleges and universities. For those who want a slower rhythm without feeling disconnected, Spring Grove's central location within south-central Pennsylvania keeps Baltimore, Lancaster, and Philadelphia all within a two-hour reach.
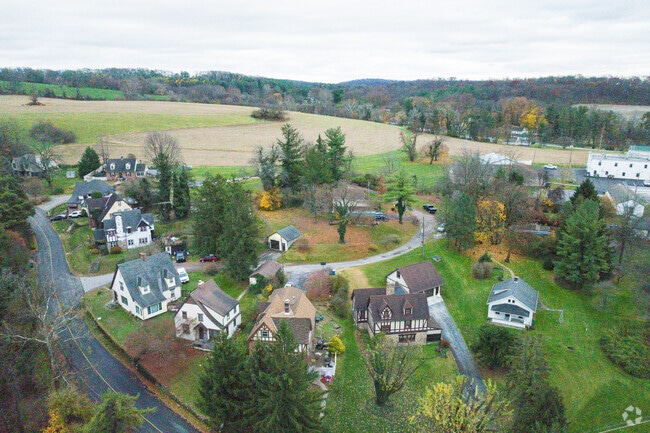
Idyllic Tudor-style homes dot the Spring Grove countryside.
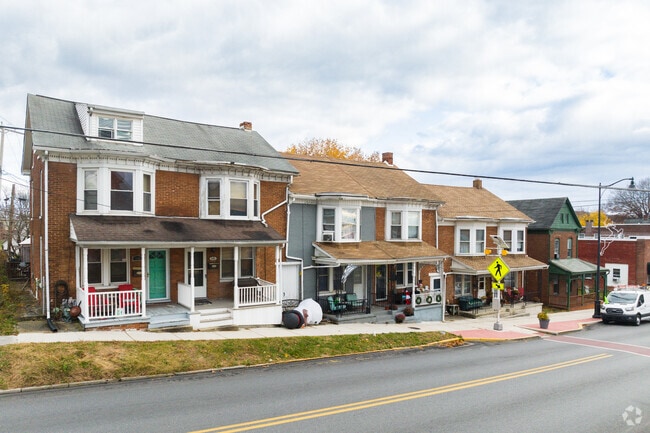
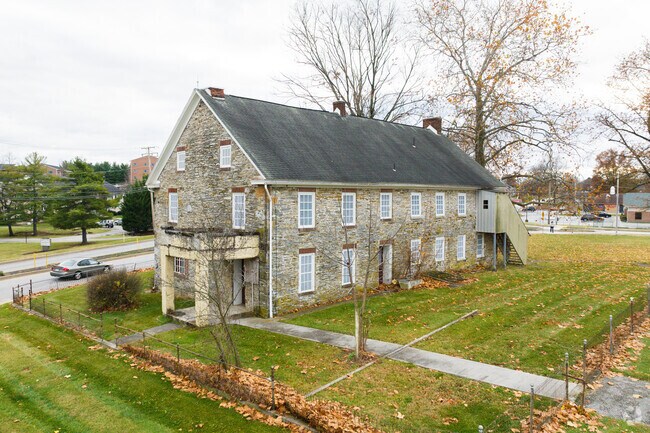
Many homes in Spring Grove are well-over a century old.
Many Spring Grove homes have been standing for centuries.
Quaint dormer windows decorate this Spring Grove home.
An aerial view of Spring Grove High School's football field.
Spring Grove Halloween Parade 2024
Median Household Income
$70,396
Average: $83,834
Education
512
Residents Have a Degree
Job Market
1,408
Workers Employed
Median Age
38 Years
Largest Age Group
30-39 Years
Approximately 14% of Residents
Under 20
26%
Over 65
18%
Housing Distribution
Spring Grove has more homeowners than renters.

Education Distribution
Review this city's overall education levels.

As of July 2026, the average apartment rent in Spring Grove, PA is $987 for one bedroom, $1,046 for two bedrooms, and $1,642 for three bedrooms. Apartment rent in Spring Grove has increased by 1.1% in the past year.
Explore how walkable, bikeable, drivable, and transit-friendly Spring Grove, PA is for everyday living.
Fairly Walkable
Walkability
Minimal Public Transit
Transit
Very Drivable
Drivability
Somewhat Bikeable
Bikeability
Public
Grades K-5
724 Students

Spring Grove Area Intrmd School
Public
Grades K-5
651 Students

Spring Grove Area Middle School
Public
Grades 6-8
656 Students
Spring Grove Area Senior High School
Public
Grades 9-12
1,177 Students

† Our analysis of utilities, groceries, transportation, healthcare, home prices, and other goods and services is sourced from the Cost of Living Index, a respected benchmark published by the Council for Community and Economic Research (C2ER) that provides a thorough overview of living expenses across different regions.
Rent data is provided by CoStar Group’s Market Trend reports. As the industry leader in commercial real estate information, analytics, and news, CoStar conducts extensive research to produce and maintain a comprehensive database of commercial real estate information. We combine this data with public record to provide the most up-to-date rental information available.
Consumer goods, services, and home prices are sourced from the Cost of Living Index published by the Council for Community and Economic Research (C2ER). The data on this page is updated quarterly. It was last published in June 2026.
Demographic information comes from Neustar and combines detailed address data with U.S. Census and American Community Survey statistics to produce reliable local estimates.


