Median Age
49 Years
Largest Age Group
60-69 Years
Approximately 14% of Residents
Under 20
20%
Over 65
29%


Area Guide
Avg Rent
$1,441
Population
5,952
Renter Mix
42% Rent
Solvang is a small California city that genuinely looks like it was lifted from the Danish countryside and set down in the Santa Ynez Valley. Founded in 1911 by Danish Americans who wanted to build a community rooted in their heritage, the city covers just three square miles yet carries a distinct architectural identity, with half-timbered facades, windmills, and cobblestone walkways woven through the downtown core. The Hans Christian Andersen Museum stands as a cultural landmark, and the annual Solvang Danish Days celebration draws visitors from across the region every fall.
Life here feels unhurried. The surrounding Santa Ynez Valley wine country sets the backdrop for daily living, and Santa Barbara is roughly 45 minutes away for those who want access to a larger city's energy. The rental landscape in Solvang tends toward smaller apartment communities, cottage-style units, and low-rise residential buildings that reflect the town's scale and historic character. Larger complexes are rare, which gives the area an intimate, neighborhood feel. For renters who prefer a quieter setting with genuine architectural charm and easy access to California's Central Coast, Solvang offers a living experience that's hard to find anywhere else in the state.
Santa Ynez Valley wineries near Solvang host frequent tastings.
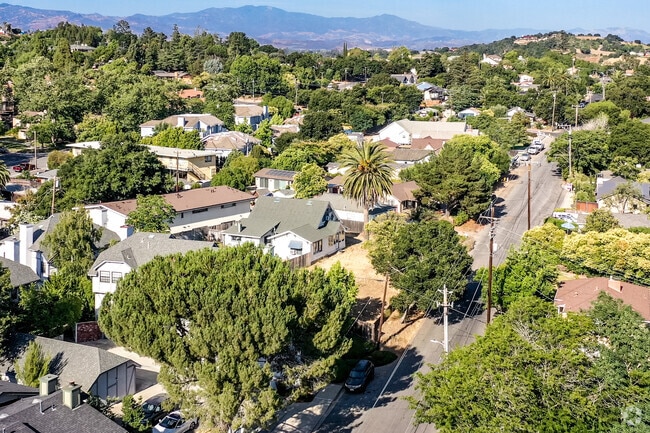
Central Solvang mixes ranch-style homes, condos, and townhomes.
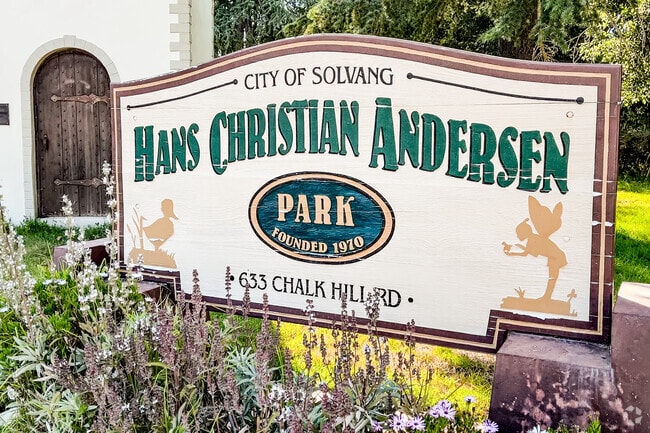
Hans Christian Andersen Park sits off Chalk Hill Road in Solvang.
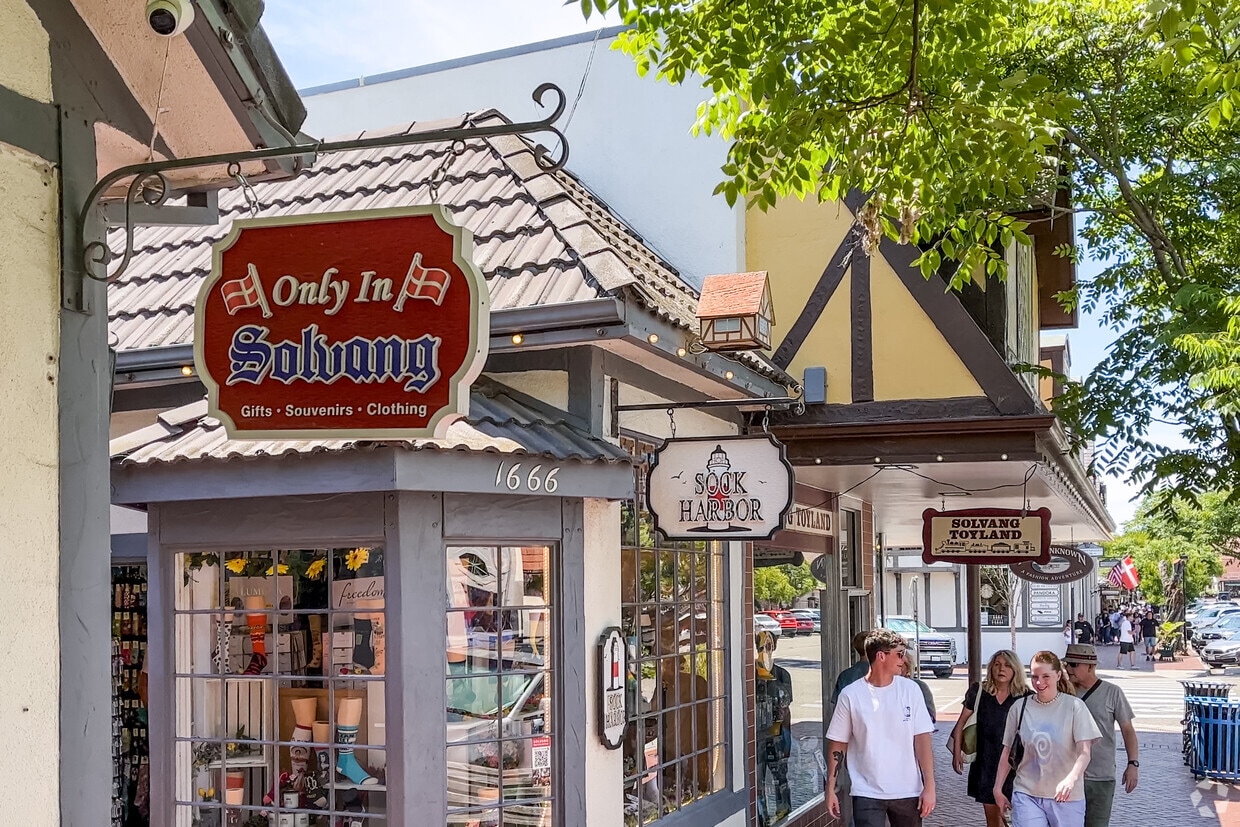
Boutiques and souvenir shops fill European-style storefronts downtown.
Solvang’s Danish village center offers year-round shopping and dining.
Solvang’s walkable village welcomes dogs on many patios.
Median Household Income
$114,268
Average: $144,072
Education
2,368
Residents Have a Degree
Job Market
3,091
Workers Employed
Median Age
49 Years
Largest Age Group
60-69 Years
Approximately 14% of Residents
Under 20
20%
Over 65
29%
Housing Distribution
Solvang has more homeowners than renters.

Education Distribution
Review this city's overall education levels.

As of June 2026, the average apartment rent in Solvang, CA is $1,452 for a studio, $1,441 for one bedroom, $2,313 for two bedrooms, and $2,594 for three bedrooms. Apartment rent in Solvang has increased by 1.4% in the past year.
Explore how walkable, bikeable, drivable, and transit-friendly Solvang, CA is for everyday living.
Somewhat Walkable
Walkability
Exceptionally Drivable
Drivability
Somewhat Bikeable
Bikeability
Public
Grades K-5
113 Students

Public
Grades K-8
602 Students

Public
Grades K-8
602 Students
Public
Grades K-5
113 Students
Public
Grades K-8
602 Students
Public
Grades K-8
602 Students
† Our analysis of utilities, groceries, transportation, healthcare, home prices, and other goods and services is sourced from the Cost of Living Index, a respected benchmark published by the Council for Community and Economic Research (C2ER) that provides a thorough overview of living expenses across different regions.
Rent data is provided by CoStar Group’s Market Trend reports. As the industry leader in commercial real estate information, analytics, and news, CoStar conducts extensive research to produce and maintain a comprehensive database of commercial real estate information. We combine this data with public record to provide the most up-to-date rental information available.
Consumer goods, services, and home prices are sourced from the Cost of Living Index published by the Council for Community and Economic Research (C2ER). The data on this page is updated quarterly. It was last published in June 2026.
Demographic information comes from Neustar and combines detailed address data with U.S. Census and American Community Survey statistics to produce reliable local estimates.


