
Lake Lucerne Towers
20 W Lucerne Cir,
Orlando, FL 32801
$1,400 - $1,775
1-2 Beds

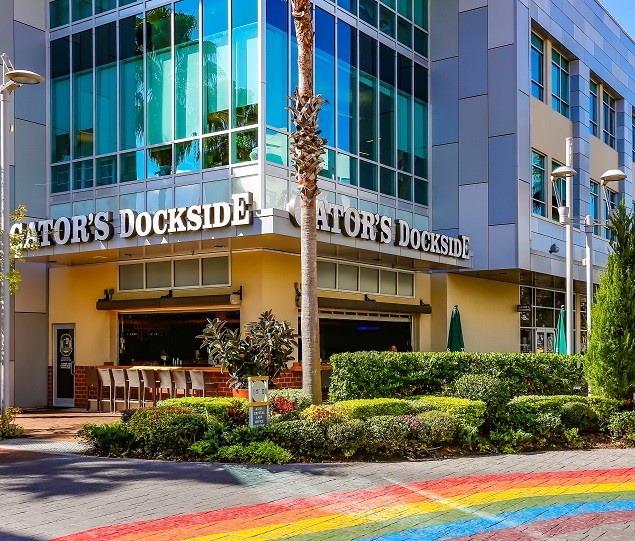

Once known as Downtown South, the SoDo District was established in 2008. The district starts on the south side of Downtown Orlando and follows I-4 to Michigan Street. This once-industrial area quickly became one of Orlando's trendiest neighborhoods, filled with mixed-use developments, nightclubs, popular restaurants, and terrific shopping. The SunRail makes travel throughout Orlando fast and easy.
Surrounded by lakes and palm trees, SoDo provides an excellent location near some of Orlando's best attractions. Residents can shop locally at SoDo Shopping Center and Orange Avenue Shopping Center, or they can head into downtown for great shopping along Church Street. By renting an apartment in SoDo, you'll enjoy easy access to Dr. Phillips Center for the Performing Arts, Lake Eola Park, and Amway Center -- home to the NBA's Orlando Magic.
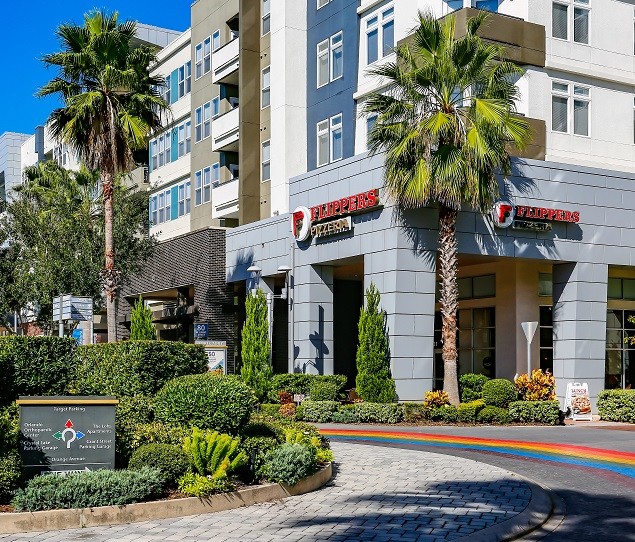
Flippers Pizzeria is one of Orlando's favorite destinations
The Arnold Palmer Hospital for Children is located in SoDo
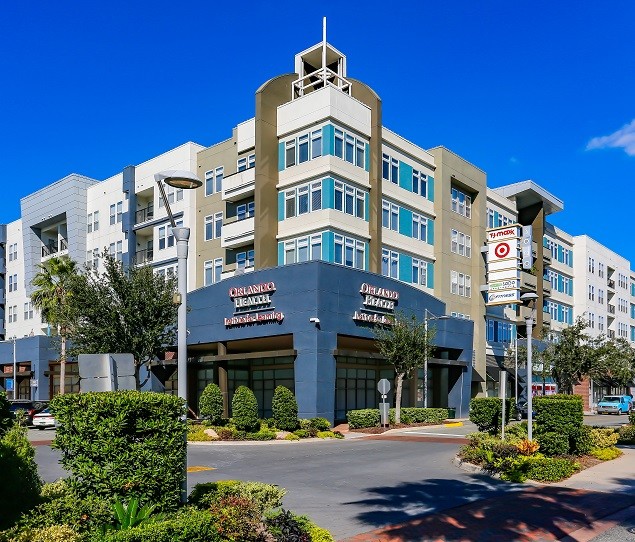
Orlando Health is located in the SoDo Shopping Center
The Orlando Orthopeaedic Center is on Crystal Lake Street
As of March 2026, the average apartment rent in SoDo is $1,605 for a studio, $1,487 for one bedroom, $2,227 for two bedrooms, and $2,533 for three bedrooms. Apartment rent in SoDo has decreased by -1.1% in the past year.
Studio
708 sq ft
Average Sq Ft
$1,605/month
Average Rent
1 BR
629 sq ft
Average Sq Ft
$1,487/month
Average Rent
2 BR
1,133 sq ft
Average Sq Ft
$2,227/month
Average Rent
3 BR
1,497 sq ft
Average Sq Ft
$2,533/month
Average Rent
Explore how walkable, bikeable, drivable, and transit-friendly SoDo - Orlando, FL is for everyday living.
Somewhat Walkable
You might be able to get out and walk when living in this area. Some errands can be accomplished on foot, but for others you’ll need a car.
Some Transit
You'll likely want a car when living in this area since it has few transit options.
Bikeable
While there’s some bike infrastructure in this area, you’ll still need a car for many errands.

3,489
Communities
958,056
Units
893
Cities

715
Communities
198,531
Units
338
Cities

631
Communities
175,806
Units
251
Cities

625
Communities
125,220
Units
245
Cities

566
Communities
126,998
Units
222
Cities

458
Communities
108,651
Units
228
Cities
† Our analysis of utilities, groceries, transportation, healthcare, home prices, and other goods and services is sourced from the Cost of Living Index, a respected benchmark published by the Council for Community and Economic Research (C2ER) that provides a thorough overview of living expenses across different regions.
Rent data is provided by CoStar Group’s Market Trend reports. As the industry leader in commercial real estate information, analytics, and news, CoStar conducts extensive research to produce and maintain a comprehensive database of commercial real estate information. We combine this data with public record to provide the most up-to-date rental information available.
Consumer goods, services, and home prices are sourced from the Cost of Living Index published by the Council for Community and Economic Research (C2ER). The data on this page is updated quarterly. It was last published in February 2026.


