
Madison Trails
745 Scenic Hwy,
Lawrenceville, GA 30046
$1,506 - $2,604
1-3 Beds
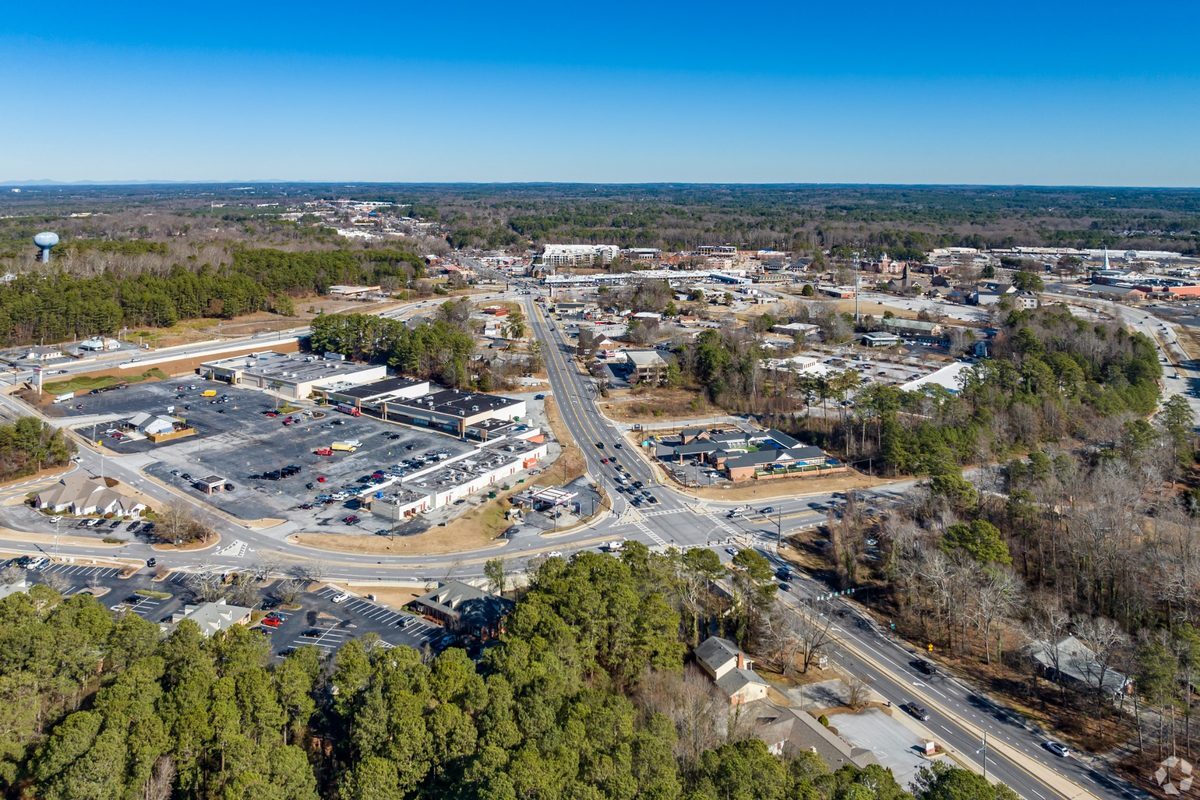

In Snellville, everybody’s proud to be somebody – and every body is on the move for an apartment to be proud of. This diverse city is northeast of Atlanta, and offers beauty, convenience, and a quality of life you’ll fully appreciate. The question however, is not “should” you consider Snellville, but “where” to take up residence.
The city’s “Snellville Days” festival is an event that many locals look forward to each year. Residents gather at Briscoe Park for fair rides, pig races, and handmade arts and crafts on the first weekend in May. Family-fun attractions in the area include bowling as well as the laser show at Stone Mountain Park. Movie fanatics enjoy taking in a movie at the cinemas just off Main Street.
Also near many Snellville apartments is South Gwinnett Park, where families meet up for pee-wee hockey games, football, and other sports. Avid golfers can hit the green at Summit Chase Golf and Country Club, which also has tennis courts for your enjoyment.
For a city of its size, Snellville offers quite the shopping destinations to appease everybody's somebody. Several upscale and specialty shops are found at the Shoppes at Webb Ginn, while Wisteria Village and Snellville Pavilion features plentiful dining options. Residents of this city appreciate living close to major roadways and highways for easy travel. Xpress operates a bus service in Snellville where passengers are picked up and dropped off in Atlanta, and then brought home at the end of the day.
Briscoe Park has many sports fields that residents of Snellville come to play games at.
As of March 2026, the average apartment rent in Snellville, GA is $1,500 for a studio, $1,547 for one bedroom, $1,802 for two bedrooms, and $2,042 for three bedrooms. Apartment rent in Snellville has decreased by -3.9% in the past year.
Explore how walkable, bikeable, drivable, and transit-friendly Snellville, GA is for everyday living.
Car-Dependent
This area is considered a car-dependent area and most errands will require a car.
Somewhat Bikeable
You might be able to find places to ride your bike in this area, but you’ll most likely want your car for most errands.
Public
Grades PK-5

Public
Grades K-5
Public
Grades PK-5
Public
Grades PK-5

Public
Grades PK-5
Public
Grades 6-8
Public
Grades 6-8
Public
Grades 9-12

Public
Grades 9-12

Public
Grades 9-12

3,490
Communities
959,772
Units
895
Cities

173
Communities
54,639
Units
102
Cities

294
Communities
78,103
Units
169
Cities

74
Communities
12,723
Units
61
Cities

47
Communities
11,049
Units
37
Cities

34
Communities
3,461
Units
26
Cities
† Our analysis of utilities, groceries, transportation, healthcare, home prices, and other goods and services is sourced from the Cost of Living Index, a respected benchmark published by the Council for Community and Economic Research (C2ER) that provides a thorough overview of living expenses across different regions.
Rent data is provided by CoStar Group’s Market Trend reports. As the industry leader in commercial real estate information, analytics, and news, CoStar conducts extensive research to produce and maintain a comprehensive database of commercial real estate information. We combine this data with public record to provide the most up-to-date rental information available.
Consumer goods, services, and home prices are sourced from the Cost of Living Index published by the Council for Community and Economic Research (C2ER). The data on this page is updated quarterly. It was last published in February 2026.


